Download
1 / 12
120 likes | 354 Views
Warm-Up 2/3. 1. 2. . D. J. Rigor: You will learn how to determine intervals on which functions are increasing, constant or decreasing, maxima and minima of functions, and rate of change of functions. Relevance: You will be able to use functions to solve real world physics problems.

E N D
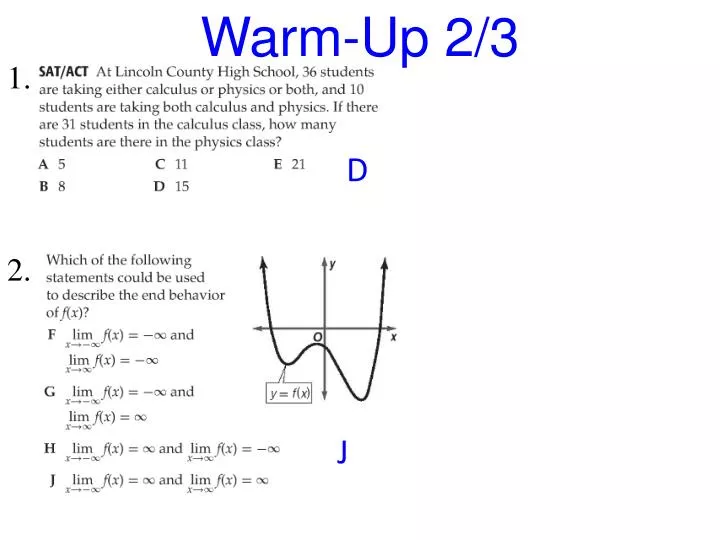
Warm-Up 2/3 1. 2. D J
Rigor:You will learn how to determine intervals on which functions are increasing, constant or decreasing, maxima and minima of functions, and rate of change of functions.Relevance:You will be able to use functions to solve real world physics problems.
Example 1: Use the graph of each function to estimate intervals to the nearest 0.5 unit on which the function is increasing, decreasing, or constant. Support the answer numerically. Support Numerically This supports the conjecture. Support Numerically This supports the conjecture.
Example 2: Estimate and classify the extrema for the graph f(x). Support the answer numerically. and So we conjecture that this function has no absolute extrema. It appears that f(x) has a relative maximum at x = – 0.5 and a relative minimum at x = 1. Support Numerically This supports the conjecture. f(x) has a relative maximum of 0.125 at x = – 0.5 and a relative minimum of – 1 at x = 1.
Example 3: Approximate to the nearest hundredth the relative or absolute extrema of . State the x-value(s) where they occur. Graph on your graphing calculator. Use CALC menu on your graphing calculator to find the maximum. Use CALC menu on your graphing calculator to find the minimum. f(x) has a relative minimum of about – 22.81 at x – 1.76 and a relative maximum of about – 1.93 at x 0.43.
Example 5: Find the average rate of change of on each interval. • a. [– 2, – 1] The average rate of change on the interval [– 2, – 1] is – 4. • b. [0, 1] • The graph supports the conclusions. The average rate of change on the interval [0, 1] is 2.
math! • 1-4 Assignment: TX p40-41, 4-44 EOE • Test Corrections Due Wednesday 2/5