Download
1 / 27
290 likes | 438 Views
Challenge of Sustainability Today. Increasing awareness of our negative impact on the planet Now making more responsible decisions in producing & buying products Need to balance sustainability with profitability. What Drives Consumers?. Cost Value Health and well-being

E N D
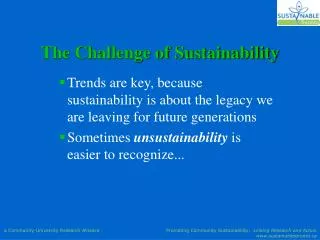
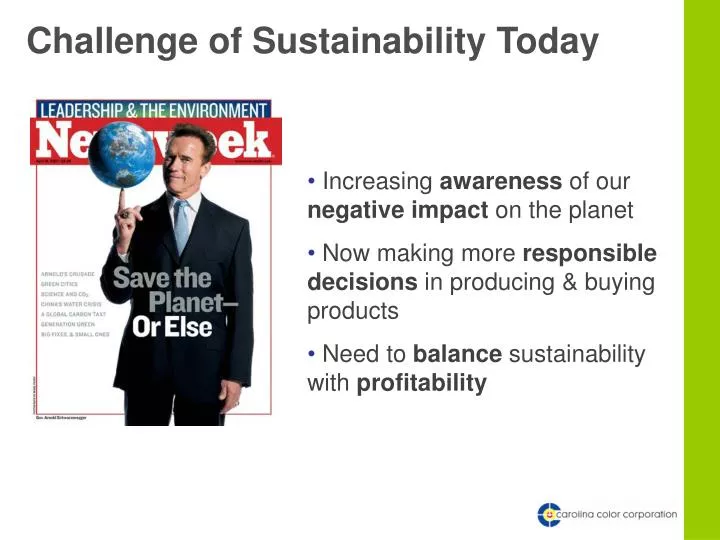
Challenge of Sustainability Today • Increasing awareness of our negative impact on the planet • Now making more responsible decisions in producing & buying products • Need to balance sustainability with profitability
What Drives Consumers? • Cost • Value • Health and well-being • Peer pressure
What Drives Industry? • Profit Motive • Competition • Brand Equity • Innovation • Desire to prevent governmental intervention
G2 Offers Profitable Way Forward Consumer Needs Industry Drivers
A Lifecycle Approach To truly improve sustainability, all phases of the product lifecycle must be considered. By recognizing each input and output of the cycle, multiple opportunities can be identified to reduce the overall impact of a product.
Lifecycle Benefits of Concentration Material Consumption Fewer Resources Component Manufacturing Better Processing Assembly & Packaging Less Packaging Distribution & Use Lower Cost
Concentrated Products = Savings • Wal-Mart committed to sell only concentrated laundry detergents • Tide 2X Ultra delivers the same performance using half the product • P&G’s annual savings: • Water: 500 million liters • C02: 100,000 tons • Truck Shipments: 40,000 • Packaging: 15,000 lbs • Source: www.Greenerpackage.com
Presenting G2— Breakthrough Technology = 50% less colorant required = Dramatically lower cost-to-color = Most environmentally friendly way to color plastics
Benefits of G2 • Reduces the amount of foreign resin in a finished part • Enhances physical properties • Reduces inventory requirements • Frees up both floor space and cash
Less Environmental Impact & Lower Costs = • 2 truckloads of conventional concentrate can be replaced by 1 truckload of Carolina Color’s G2 • Lowering converters’ costs by 15-20%
One Truckload of G2 Saves… Fuel Savings 60 gal of diesel Energy Savings 2.4 tons of coal Greenhouse Gas Reduction 9.1 tons of CO2 Source: 2009 Life Cycle Inventory - Carolina Color Corp.
Appendix Carbon Footprint Calculations:vs. Traditional Color Concentrates
Goal and Scope • Goal • Estimate the reduction in carbon dioxide emissions by replacing conventional color concentrates for plastic with G2 color concentrates. • Scope • Raw Materials Acquisition: Transportation of materials from the supplier to CCC receiving docks • Production: Blending and extrusion (Note: the same equipment used for G2 and conventional concentrates) • Packaging • Shipping: transporting the product to our customer • Product Use: advantages our customers find in using G2 • All calculations are based on 40,000lb of G2 (or 1 truckload).
Process Flow Customer Processing Transportation Resins, pigments, additives, dispersion aid, changeover materials Manufacturing: Mixing Extrusion Packaging Changeover G2 Products Packaging Energy
Conventional Concentrate Pigments, additives Dispersion aids Resins Purge materials for changeovers Electricity Equipment Packaging Transporting packaging to CCC Transporting product Customer use of product G2 Products Same 50% reduction 50% reduction** 25% reduction 50% reduction Same 50% reduction 50% reduction, but nil 50% reduction Reduced energy consumption G2 v. Conventional Concentrate* * Each truckload of G2 replaces 2 truckloads of conventional concentrate. ** Although there is a 50% reduction in the amount of carrier resin we use in G2, the customer ends up replacing that difference in their process, yielding no net emissions reduction.
Reduced Amounts of Dispersion Aids • G2 utilizes the same level of dispersion aids as conventional color concentrate; on the average, about 2% by weight. • Since each truckload of G2 eliminates the equivalent of 40K lbs of conventional concentrate, there is a 800 lb reduction in the amount of dispersion aids used. • In concentrate production the primary dispersion aids are derived from animal fat and vegetable oil by way of saponification (soap manufacturing), for which the CO2 outputs are known. • Specifically, for every metric ton of soap produced, 1.24 metric tons (MT) of CO2 are emitted (Ref. 1). By reducing dispersion aid use by 800lbs we reduce CO2 emissions by 0.45 MT.
Reduced Use of Purge Resin • We find that most customers who switch from conventional concentrate to G2 continue to order the same quantity, but less frequently, to take advantage of discounts for purchasing in the larger order size. This practice results in about 25% fewer changeovers between orders. • Each changeover consumes about 100lb of purge resin, typically polyethylene (PE). According to the CPM LCA data base (Ref. 1), each MT of PE produced has a CO2 footprint of 1.1 MT. • A truckload of G2 replaces 2 truckloads of conventional concentrate which required from 2000 to 8000 lbs of changeover purge, depending on individual production lot sizes. Taking 25% of the smaller number, we conservatively estimate a reduction of 500lb (=0.23 MT) of purge resin and a corresponding reduction in CO2 emissions of 0.25 MT.
Reduced Use of Production Energy • Our measurements indicate it takes about 320 kJ of electricity to produce 1 pound of G2 or traditional concentrate, taking into account the energy for mixing the ingredients, heating the extruder barrel, and extruding the product. • Each truckload of G2 replaces 2 truckloads of conventional concentrate • Using the conversion factor from electrical energy to CO2 emissions given in the appendix, we estimate each truckload of G2 produced and sold reduces CO2 emissions by 4.6 MT.
Packaging Materials Reduction • The average net weight of product per package is 400lbs (based on our current usage of fiber drums v. paperboard cartons). • The average weight of paper used per package works out to18 lbs. • Each truckload of G2 therefore represents 100 packages containing 1800lb (= 0.820 MT) of fiber drums and paperboard cartons. • Each truckload of G2 eliminates 1 truckload of conventional concentrate. Applying the heat energy to CO2 conversion factor given in the appendix, we find that reducing the packaging materials by 0.82 MT reduces the carbon footprint by 3.1 MT of CO2 . • Note: Each truckload of G2 or conventional concentrate also makes use of 40 wood pallets (about 1200 lbs). To assure our estimates are conservative, we ignore the energy saved not having to produce and ship 40 pallets to our receiving dock. We also ignore the energy used to ship the cartons and drums to our manufacturing facilities.
Transportation Reductions • On the average, a delivery truck travels 300 miles to pick up the product and deliver it to our customer, burning diesel fuel at a rate of about 5 mpg. • Each truckload (1 unit) of concentrate saves a corresponding truckload of conventional concentrate and saves 60 gal of diesel fuel. • Using the diesel fuel to CO2 conversion given in the appendix, we estimate each truckload of G2 yields a corresponding reduction in shipping related emissions of about 0.7 MT CO2.
Energy Savings for the Customer • Our customers report they are able to reduce their processing temperatures by up to 10 deg C when using G2 v. conventional concentrate. • This figure varies from one customer to the next, so we’ll calculate the emissions reduction as tons CO2 for each 1 deg C the processing temperature is lowered because of G2. • The great majority of G2 goes into coloring PE resins, and each truckload of G2 colors 4 million pounds of PE (1818 MT). • Applying the conversion factor (heating up PE --> CO2 emissions) given in the appendix, we estimate for each 1 deg C reduction in our customers processing temperature there is a corresponding reduction in CO2 emissions of 1.8 MT.
Conclusions • Replacing conventional color concentrates (typically used at 2% of the total batch to be colored) with G2 color concentrates can reduce carbon dioxide emissions by 9.3 MT for each truckload of G2 used. • In addition, numerous customers of G2 claim they are able to reduce their processing temperatures (most likely because of G2’s patented composition) by upwards of 10 deg C. For each 1 deg C (average over the customer base) reduction in process temperature, there is a corresponding 1.7 MT decrease in CO2 emissions for each truckload of G2 used. • CO2 is a greenhouse gas that can absorb infrared energy and thereby trap heat. Using G2 concentrates provides plastics processers an opportunity to help reduce CO2 emissions while reducing coloring costs: a Green-Green proposition.
Conversion Factors • CO2 emissions from the production of electricity in a coal fired plant with 40% efficiency • Multiply the kilojoules used by the factor: 0.36 MT of CO2 / 1 million kJ. (derived from information provided in Ref. 2.) • CO2 emissions from corrugated paper and paperboard production assuming coal is the primary energy source and 100% recycled paper fibers are used • Multiply the number of metric tons (MT) of paper by 3.81 to obtain the MT of CO2 emissions (derived from information provided in Ref. 2 and 3). • CO2 emissions from diesel fuel • Multiply the number of gallons of diesel fuel (which is about 85% carbon by weight) by 0.0114 to get the MT of CO2 emissions. • CO2 emissions saved by reducing processing temperatures • Multiply the number of units of G2 used by the customer by 1.8 to get the MT of CO2 emissions saved for each 1 deg C the customer is able to reduce the processing temperature. (Factor is derived from information provided in Ref. 2 and 4.)
References • CPM LCA Data base, Center for Environmental Assessment of Product and Material Systems, Chalmers University of Technology, Sweden. • Energy Information Administration, Department of Energy, 2007 • “U.S. Energy Conservation and Efficiency: Benefits and Costs”, D. Pimentel, etal, College of Agriculture and Life Sciences, Cornell University, Ithaca, NY, April 26, 2002, p. 13. www. hubbertpeak.com/ Pimentel/ bioscience/ conservation/ conservation.pdf. We discounted the figure given in this reference by 33% based on other, less well documented, estimates of the energy needed to produce corrugated paper and cardboard found in the literature. • www.novachem.com/ResearchTech/docs/2005-06.pdf. Page 9 shows a graph of the heat capacity of PE at various processing temperatures.
Thank You Matt Barr President BarrM@carolinacolor.com 704-906-1481