Download
1 / 31
310 likes | 315 Views
Learn how to optimize contrast material injection and image acquisition techniques in order to improve contrast enhancement and reduce radiation dose for CT angiography in the emergency department.

E N D
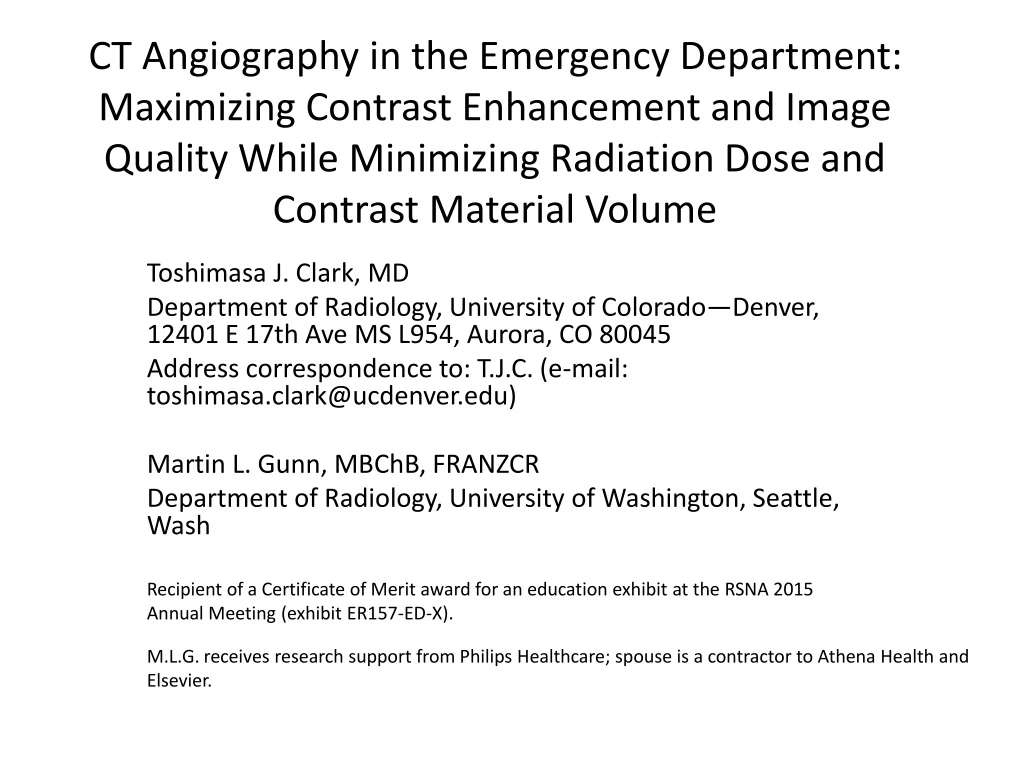
CT Angiography in the Emergency Department: Maximizing Contrast Enhancement and Image Quality While Minimizing Radiation Dose and Contrast Material Volume Toshimasa J. Clark, MD Department of Radiology, University of Colorado—Denver, 12401 E 17th Ave MS L954, Aurora, CO 80045 Address correspondence to: T.J.C. (e-mail: toshimasa.clark@ucdenver.edu) Martin L. Gunn, MBChB, FRANZCR Department of Radiology, University of Washington, Seattle, Wash Recipient of a Certificate of Merit award for an education exhibit at the RSNA 2015 Annual Meeting (exhibit ER157-ED-X). M.L.G. receives research support from Philips Healthcare; spouse is a contractor to Athena Health and Elsevier.
Introduction Computed tomographic (CT) angiographic image quality is highly dependent on contrast material injection and image acquisition technique. To provide patient-centric care, one should tailor the technique to the clinical question and the characteristics of each patient. In this RadioGraphics Fundamentals presentation, we simplify the topics of intravenous contrast material dynamics and technique optimization and describe how dual-energy and fast CT angiography can allow for further image quality improvement while reducing the contrast material volume and radiation dose.
Overview • Principles of contrast material flow • Contrast agents and timing techniques • Factors that influence iodine enhancement: • Iodine flux (concentration, rate, viscosity) and patient factors (intravenous line, cardiac output, height, age, sex) • Volume of contrast material • Timing of CT relative to arrival of iodinated agent • Kilovoltage peak • Low contrast material dose CT angiography and dual-energy CT angiography • CT angiography with fast (wide detector array and dual-source) scanners
Learning Objectives At the end of this presentation, the reader should be able to: • Recognize the principles of intravenous contrast material flow and the factors that influence contrast enhancement in the performance of CT angiography. • Modify one’s local protocols to maximize contrast enhancement, while minimizing image quality variability, contrast material usage, and radiation dose. • Recognize when patient factors will lead to suboptimal image quality if a standard CT angiographic protocol were to be used and know how to optimize the contrast material injection protocol and CT technique to accommodate these factors. • Apply newer technologies, such as dual-energy CT and low contrast material dose CT angiography, to improve image quality.
Contrast Material Flow Generally, contrast material flows through the body in a predefined circuit, beginning with a peripheral vein. Peripheral Venous Access Right Side of Heart Pulmonary Circulation 10–25 seconds Left Side of Heart Liver ~65 seconds Organ Parenchyma 40–55 seconds Systemic Arteries ~25 seconds
Principles of Contrast Material Injection:The Dual-Chamber Power Injector • Most sites now use dual-chamber injectors for iodinated intravenous contrast material delivery, with flow rates between 1 and 6 mL/sec. • A saline chaser is usually used too, because it: • Flushes contrast material from systemic veins and superior vena cava • Reduces streak artifact • Reduces contrast material volume • Can increase peak aortic enhancement if injected rapidly CONTRAST MATERIAL SALINE No-Chaser Streak Saline Chaser
Dual-Chamber Injector: Varying Injected Iodine Concentration • By using a dual-chamber injector, it is possible to vary the flow rate of the contrast material and saline infusion. • The principle is simple—if 350 mg of iodine per milliliter is injected at the same flow rate as normal saline at the same time, the iodine concentration injected will be 175 mg of iodine per milliliter. • Dynamically varying the mixture of saline has several applications. For example, it can reduce artifacts from highly concentrated contrast material in the venous structures and the right side of the heart at coronary CT angiography. It is also valuable for multi-rule-out CT angiography of the chest in the emergency department.
Timing Contrast Material Arrival TIMING BOLUS • Three principal contrast material timing techniques: • Empiric delay • Works well in most solid organs • Quick setup • Timing bolus • Reference scan depicting organ of interest is performed, and time-attenuation curve is generated after injection of a 2–20 mL bolus of contrast material by using a region of interest cursor (red circle in top right figure). • Contrast material arrival (transit) time is then calculated (peak labeled with gray arrow in bottom right figure). • Main scan is then performed by using the full dose of contrast material, timed at the peak, plus a further delay that is used due to the longer injection duration, as explained later. • Bolus tracking 175 150 Relative HU 125 100 75 50 25 0 0 5 10 15 20 25 30 Elapsed Time (sec)
ROI Bolus Tracking or Triggering • Manufacturers have trade names for bolus tracking, including: • SmartPrep(GE), CARE Bolus (Siemens Healthineers), Bolus Pro (Philips) • With a bolus tracking technique, a reference scan is performed. • A region of interest is placed on the target organ. • An attenuation threshold is programmed into the scanner. • The full volume of contrast material is injected. • When the attenuation reaches the threshold, or the CT technologist sees the contrast material arrive, the scanner is triggered to begin scanning after a prescandelay (usually 3–10 seconds).
Factors That Influence Contrast Enhancement • Iodine flux (ie, iodine delivery per unit time) • Iodine flux is dependent on three factors: • Iodine concentration in contrast agent • Contrast material flow rate • Patient factors (cardiac output, weight, intravenous line location, height, age, sex) • Volume of contrast material used • Timing of CT relative to arrival of iodinated contrast material • Tube potential
Contrast Material Concentration and Iodine Flux • For a given contrast material viscosity, iodine flux is linearly proportional to the contrast material concentration. • CT contrast material in the United States contains 300–370 mg of iodine per milliliter. • For example, iohexol (Omnipaque) 300, iohexol 350, iodixanol (Visipaque) 320 • If injecting at 5 mL/sec: • Iohexol 300: 1500 mg of iodine per second • Iodixanol 320: 1600 mg of iodine per second • Iodine flux is increased 7% versus iohexol300. • Iohexol 350: 1750 mg of iodine per second • Iodine flux is increased 17% versus iohexol300. • One would need to inject iohexol300 at6 mL/sec(1800 mg of iodine per second) to approximate iohexol350 at 5 mL/sec.
Contrast Material Injection Rate and Iodine Flux AORTA LIVER • The graphs above demonstrate the effect of 125 mL of contrast material injected at various flow rates on aortic (left) and liver (right) enhancement. • Note that higher contrast material flow rates increase vascular enhancement substantiallybut have a small effect on the magnitude of parenchymal enhancement. • Higher flow rates also shorten the time to peak enhancement, and the shorter injection duration results in decreased time of sustained near-peak enhancement. Compare the narrow green peak for 5 mL/sec in the aorta with the wider orange peak for 3 mL/sec. Graphs inspired by Bae, Radiology 256(1), July 2010 and independently re-created in MATLAB (MathWorks, Natick, Mass).
Vascular Enhancement with Long Duration Injections • Due to an effect called hemodynamic perturbation(the flow of contrast material speeds venous return and shortens contrast material arrival time), the end of the contrast enhancement peak is earlier than would be otherwise expected given the contrast material arrival time plus injection duration (orange line and green arrow). • Due to recirculation, the peak enhancement is greatest near the end of the bolus. • Peak enhancement is increased but shortened due to recirculation and perturbation, respectively. Recirculation 300 200 Vascular Enhancement (HU) Contrast material injection duration Hemodynamic Perturbation 100 0 0 5 10 15 20 25 30 35 40 Time After Start of Injection (sec) Time (sec) Graph adapted from Bae, Radiology 256(1), July 2010. Recirculation is greater than would typically be seen with CT for illustrative purposes.
Patient Factors • Larger patients generally have a larger blood volume, which leads to a greater dilution of contrast material. • Enhancement is affected by patient weight for a given volume of contrast material: • Generally, there is less enhancement with more weight. • It is therefore standard practice to tailor contrast material volume to weight, although lean body mass and body surface area are more strongly correlated with blood volume. • One can calculate volume by using formulas, injector software, or a chart (example below from the authors’ institution). • Contrast material timing is largely unaffected by weight.
Cardiac Output: Example—Pregnancy • Cardiac output affects timing and magnitude of iodine enhancement. • Circulating concentration is proportionate to the volume of blood traveling per second and the iodine flux delivered per second. 8 • In low cardiac output states (eg, heart disease), there is delayed but higher vascular iodine enhancement. • In higher cardiac output states (eg, pregnancy), there is earlier but lower vascular iodine enhancement. Third Trimester 7.2 L/min 7 In pregnancy, the cardiac output can increase by more than 50%. To achieve adequate vascular enhancement (eg, pulmonary embolism studies), the flow rate should be increased. Cardiac Output (L/min) 6 Baseline 4.8 L/min 5 38 Pre 5 8 12 16 20 24 28 32 46 Post Gestation (weeks) Graph adapted from Robson et al. Serial study of factors influencing changes in cardiac output during human pregnancy. Am J Physiol 1989;256:H1060–5.
CT Pulmonary Angiography in Pregnancy 100 mL of contrast material at 5 mL/sec this yields a 20-second duration bolus. The cardiac output in 20 seconds is: Nonpregnant patient: 4.8 L/min 1.6 L of blood in 20 seconds [Contrast material] = 100/1600 = 62.5 mL of contrast material per liter Pregnant patient: 7.2 L/min 2.4 L of blood in 20 seconds [Contrast material] = 100/2400 = 41.6 mL of contrast material per liter 50% lower concentration of contrast material in a pregnant patient with same injection protocol, simply because of the different cardiac output For pregnant patients: • Inject at a higher flow rate, or • Use higher concentration contrast material, or • Use a lower kilovoltage peak, or • Think about a different study (eg, ventilation-perfusion scan)
Contrast Material Volume AORTA • Larger volumes of contrast material equate to increased injection duration at a given injection rate of 5 mL/sec. • Larger volumes delaytime to peak enhancement and increase peak enhancement in both the aorta and liver. Graph adapted from Bae, Radiology 227(3), June 2003 and re-created independently in MATLAB.
Timing CT Relative to Peak Enhancement 16detector row CT 16–detector row CT AORTA 64 (or higher)–detector row CT 64 (or higher)–detector row CT • Faster scanners (eg, 64 [or higher]–detector row CT) have shorter acquisition times, allowing one to achieve higher attenuation by injecting at a faster rate (increased iodine flux) and starting the acquisition later (delay relative to 16–detector row CT for aortic imaging shown by red arrow). • Scanner speed and perfect timing are less important for parenchymal organs (eg, liver) because the time-attenuation curve is broader and the peak is lower. This is why empiric scan delays are more successful for parenchymal organs (eg, venous phase abdomen) at CT than at angiography. LIVER 300 200 Enhancement (HU) 100 90 100 120 Time (sec) Time (sec) 0 0 10 20 30 40 50 60 70 80
Low Contrast Material Dose CT Angiography and Dual-Energy CT Angiography
General Principles of Low Iodinated Contrast Material Dose Angiography • There are widespread concerns about postcontrast acute kidney injury. • However, there is no conclusive evidence that the risk of acute kidney injury after administration of iodinated contrast material is dose related. • Some studies have shown that the risk of postcontrastacute kidney injury (formerly referred to as contrast-induced nephropathy) may be negligible to nonexistent. • Increasing iodinated contrast material dose may be associated with increasing toxicity, on the basis of general toxicology dose-response curves, but we do not know what part of the curve we are at when we use CT doses of contrast material. • To be prudent, we can perform low contrast material dose CT angiography if we cannot perform MR angiography or ultrasonography.
General Principles of Low Iodinated Contrast Material Dose Angiography • Do not drop flow rate too low. • Vascular enhancement is dependent on flow rate. • Volume (mL) = flow rate (mL/sec) x duration (sec) • If one keeps the flow rate constant and reduces volume, the injection duration will decline proportionately. According to the principles in the earlier slides, this means that there will be: • Earlier peak vascular enhancement • Shorter scan duration (because bolus will be shorter) • Less overall enhancement • Therefore, one must scan faster and earlier to maximize enhancement! One should also consider a lower kilovoltage peak technique.
General Principles of Low Iodinated Contrast Material Dose Angiography • Be sure to get timing correct due to shorter duration (use timing bolus with 1–2 mL of contrast material or bolus triggering with manual trigger). • Decreasing scan range can also be used to decrease image acquisition time. • Use a lower kilovoltage peak technique (eg, 80 or 70 kVp) to maximize iodine attenuation. • Using dual-energy CT with low-energy reconstruction images will also increase iodine attenuation. • Both low kilovoltage peak and dual-energy CT will increase artifacts (hardening, noise), especially in obese patients, so one needs to increase tube current–time product to compensate for noisy images. • Tube current modulation will only go so far: one could max out the tube and generator output. • Hence, more powerful tubes and generators are available on current CT scanners.
CT: Polychromatic Photon Beam CT scanners emit a polychromatic x-ray beam, described by the kilovoltagepeak potential between the cathode and anode of the x-ray tube. A substantial proportion of the photons are lower energy than the kilovoltage peak. Photons of lower kiloelectron-volt are attenuated more than those of higher kiloelectron-volt, partly because of an increasing contribution of the photoelectric effect. k-edge of I 80 kVp 100 kVp 120 kVp kVp Photon number 120 33.2 Photon energy (keV)
Kilovoltage Peak and Iodine Attenuation 140 kVp 120 kVp 100 kVp 80 kVp 390 HU 491 HU 322 HU 652 HU These images depict a bag of diluted iodinated contrast material (red circles) scanned at several kilovoltage peaks to illustrate dependence of measured attenuation on peak voltage. The attenuation of iodine increases with reducing kilovoltage peak. This can also be seen in vivo.
Kilovoltage Peak and Iodine Attenuation 993.3 HU ± 97.9 626.4 HU ± 45.8 332.1 HU ± 27.3 250.4 HU ± 37.8 40 keV 51 keV 68 keV 77 keV These images depict increasing iodine attenuation with lower kilovoltage peak. (Images courtesy of Lee Mitsumori, MD)
Low Contrast Material Dose CT Angiography in Practice In this example, a standard kilovoltage peak and standard weight-based contrast material volume was used at baseline CT angiography in a 50-year-old woman. At follow-up CT angiography, a low iodinated contrast material dose technique was used, enabled by a lower kilovoltage peak (for increased iodinated attenuation) and shortened scan duration (to allow for imaging of peak enhancement even during the shorter duration of the contrast material bolus). Baseline CT Angiography Follow-up CT Angiography 130 mL 100 kVp 20 mL 80 kVp
Dual-Energy CT A dual-energy CT technique provides two characteristics that are beneficial when performing CT angiography in the emergency department: Virtual monochromatic images (as if from photons of a given, fixed kiloelectron-volt rather than a spectrum) can be created. This in turn is beneficial because of the increasing attenuation of iodine with decreasing kiloelectron-volt. Material decomposition by the atomic weight of elements is possible, with production of images that have only elements of a given atomic weight (eg, iodine map) or those that exclude elements of a given atomic weight (eg, virtual non–contrast-enhanced image). Iodine map Virtual non–contrast- enhanced image
Dual-Energy CT—Effect of Kiloelectron-Volt at CT Angiography As this movie of dual-energy CT angiography plays, note the kiloelectron-volt in the lower left corner. As the kiloelectron-volt decreases (slider), the iodine attenuation appears to increase. This characteristic is fundamental to dual-energy CT angiography in the emergency department: Lower iodine doses can be used with adequate iodine enhancement.
Conclusions • Readers can provide patient-centric care by optimizing contrast material injection and image acquisition technique for each of their patients. • This presentation provides an overview of intravenous contrast material dynamics and the relationship of contrast material injection rate, volume, and patient factors. • For optimal vascular opacification, contrast material injection rate should be maximized, which requires precise timing of image acquisition relative to start of injection tailored to the patient’s blood volume and cardiac output. • Low contrast material dose CT angiography requires further optimization of technique that can be achieved with low kilovoltage peak and dual-energy acquisition performed with fast multidetector scanners.
Suggested Readings • Bae KT. Intravenous contrast medium administration and scan timing at CT: considerations and approaches. Radiology 2010; 256(1):32–61. • Bae KT. Peak contrast enhancement in CT and MR angiography: when does it occur and why? Pharmacokinetic study in a porcine model. Radiology 2003; 227:809–816. • Mourits MM, Nijhof WH, van Leuken MH, Jager GJ, Rutten MJ. Reducing contrast medium volume and tube voltage in CT angiography of the pulmonary artery. ClinRadiol 2016; 71(6):615.e7–615.e13. • Schindera ST, Nelson RC, Howle L, et al. Effect of varying injection rates of a saline chaser on aortic enhancement in CT angiography: phantom study. EurRadiol 2008;18(8):1683–1689. • Kim DJ, Kim TH, Kim SJ, et al. Saline flush effect for enhancement of aorta and coronary arteries at multidetector CT coronary angiography. Radiology 2008;246(1):110–115. • Kerl JM, Ravenel JG, Nguyen SA, et al. Right heart: split-bolus injection of diluted contrast medium for visualization at coronary CT angiography. Radiology 2008:247(2):356–364. • Shahir K, Goodman LR, Tali A, et al. Pulmonary embolism in pregnancy: CT pulmonary angiography versus perfusion scanning. Am J Roentgenol 2010; 195(3):W214–220. • McDonald JS, McDonald RJ, Comin J, et al. Frequency of acute kidney injury following intravenous contrast medium administration: a systematic review and meta-analysis. Radioogy2013;267(1):119–128. • McDonald JS, McDonald RJ, Carter RE, et al. Risk of intravenous contrast material-mediated acute kidney injury: a propensity score-matched study stratified by baseline-estimated glomerular filtration rate. Radiology 2014;271(1):65–73.