Download
1 / 20
200 likes | 303 Views
Rating Snowstorms Based on Travel Impacts. Ernie Ostuno National Weather Service, GRR. Storm Impact: Travel Conditions. Recent survey found (not surprisingly) that travel impacts were the leading cause of people altering their normal routines during snowstorms. Two Methods of Ranking Storms.

E N D
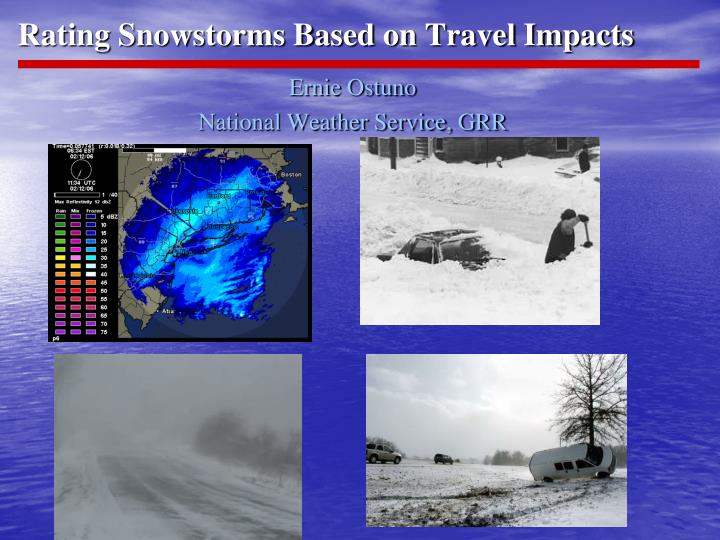
Rating Snowstorms Based on Travel Impacts Ernie Ostuno National Weather Service, GRR
Storm Impact: Travel Conditions Recent survey found (not surprisingly) that travel impacts were the leading cause of people altering their normal routines during snowstorms
Two Methods of Ranking Storms • Pre-Storm: • Saffir/Simpson scale: damage potential • Post-Storm: • EF scale: damage assessment
Winter Storms: Criteria vs. Impact • NWS warning criteria based on amount and rate of snow • Impact: primarily the effect on travel conditions, which we don’t explicitly forecast • Zielinski (2002), Grumm and Hart (2001) rated winter storms based on meteorology • Kocin and Ucellini (2004) rated winter storms based on impacts • The impacts did not include taking into account some important variables
Northeast Storms Severity Index • Based on amount of snow that affects the greatest area/most population • Somewhat analogous to the EF-scale; tornado will likely get a higher rating if it hits a city • Ranks 11-12 Feb 1983 higher than 6-7 Feb 1978 • Not accounted for: Timing, winds, temperatures, local severity
Variables Affecting Travel Impacts • Snow: Amount, Rate, Timing • Wind: Speed and Duration • Temperature: Hypothermia, Road Salt • Icing: Freezing rain, rain to snow
Ranking Historic Northeast Snowstorms • February 6-7, 1978 • January 7-8, 1996 • February 11-12, 1983 and 2006 • February 16-17, 2003 • April 1, 1997 and April 6, 1982 Ranking Factors: Amount of snow, winds, persistence of deep snow Societal impacts to account for: Economic disruption, travel bans Discussion point: which is more important, snow amount or wind? Drifting snow and snowfall rates are important factors in affecting travel, as well as timing What makes a storm memorable enough to mark anniversaries of it?
Rankings by Snow, Wind* Wind 40…1978 37…1996 36…2006 33…2003 28…1983 Rank points** 2006…9.5 1978…9.5 1996…9 1983…5.5 2003…4 Snow 17.7…2006 15.5…1983 15.4…1996 15.1…1978 13.1…2003 *Average of BDR and BDL snow totals and peak winds ** Top ranking for each category is given 5 points, next highest given 4 points, etc., then added together. Wind is given a weighting factor of 1.5
A Look at One Possibly Important Variable: Snow Depth Following some of the Big Storms Snow depth in inches (y-axis) measured each day after the storm (x-axis) Post-storm assessment ranking: 10 inches or more on the ground 5 days after = 1 point 10 inches or more on the ground 10 days after = 2 points
Final Ranking Rank points 1978…11.5 1996…11 2006…10.5 1983…6.5 2003…4
“The Old 1 to 5 Scale” Wind (mph) Snow (In) Temp (F) >40… 5 >12… 5 <15… 5 30-40… 4 8-12… 4 15-20… 4 20-29… 3 4-8… 3 20-25… 3 10-19… 2 2-4… 2 25-30… 2 <10… 1 <2… 1 >30… 1 *Amounts can vary based on forecast zones*
Graphical Forecasts Peak Wind + Snow +Temp Impact Forecast generated from graphics that are already being produced and calculated as follows: 45 % Wind + 40 % Snow + 15 % Temperature Example: Wind = 35, Snow = 10 and Temp = 20 Impact = 4(.45) + 4 (.4) + 3 (.15) = 3.85 = Impact
Let’s Look at Some Examples Two recent cases show the difficulties in assessing impacts Discussion points • Severity vs. Impact • Timing is everything? • Can we forecast road conditions? • What about icing?
Winter Storm of 3 Feb 2007 • High impact event with road closures, blizzard conditions and extreme cold • Impact mitigated since it hit on weekend • Highly variable conditions, but frequent whiteouts in falling and blowing snow
Winter Storm of 30 Jan 2008 • High Impact rain to snow event with extremely poor travel conditions • Quick temperature drop with a “flash freeze” of rain into a sheet of snow covered ice • Cold temperatures greatly reduced the effectiveness of road salt • Travel conditions were bad for several days
Other high impact winter events: • Black ice • “Clear Air” drifting of snow • Localized whiteouts • Localized dense fog from snowmelt • Dirt Roads icing over in thaw situations • High winds after ice storms causing continued power outages These are high impact events that we must anticipate and communicate better!
Strategy for Communicating Impacts of Winter Storms • A rating system for winter storms based on impacts can help communicate how “bad” a storm will be • Existing forecast parameters can be used to calculate impacts • No easy way to account for so many variables • Each storm is different; recognize the main impacts • Stress major impacts in briefings/NWSChat/AFDs • Choose wording that best conveys what the major impacts will be
In Summary Diagnose the Meteorology Assess the Impacts Describe the Event