Download
1 / 36
360 likes | 452 Views
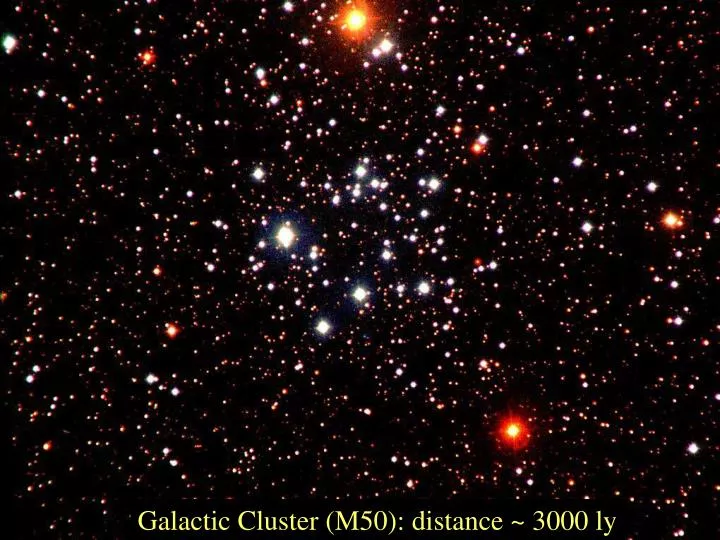
Galactic Cluster (M50): distance ~ 3000 ly. The Stars - as physical objects. Observations Stars emit energy into space We know this because we can “see” them and light is a form of EM radiation, and EM waves carry energy. It’s bowf. We also know that some stars are brighter

E N D
The Stars - as physical objects Observations Stars emit energy into space We know this because we can “see” them and light is a form of EM radiation, and EM waves carry energy It’s bowf We also know that some stars are brighter than others – this relates to measured flux The greater the flux, the brighter the star appears to us OOTETK Question: Are brightness differences due to variations in stellar luminosity or distance (or both) ?
The flux is the thing • The message in starlight is entirely encoded within the measured flux • Energy received /m2 / sec • Spectrum = flux variation with wavelength • Star composition (what stars are made of) • Star types (classification scheme) • Star temperatures (stellar thermometer) • Star rotation motion (Doppler effect) • Star distances (standard candles) • Magnetic fields, mass loss, …….
Never Say Never “there is no conceivable means by which we shall one day determine the chemical composition of the stars” • Auguste Comte (1798 - 1857) • French Philosopher (bad prophet) • Founder of the Social Sciences • Espoused the philosophy of positivism – as seen on the Brazilian flag – “Love as a principle and order as the basis; progress as the goal.”
Stellar spectra Stars radiate most of their EM radiation at UV, Visual and IR wavelengths They also show distinctive absorption lines due to specific atoms (hydrogen, helium,…) and in some cases molecules in their outer, cooler layers – an atomic “thumbprint” Recall: absorption lines were used to study star / galaxy motion via the Doppler effect Sun-like stars Absorption lines Spectral classification scheme
Recognizing similar stars to the Sun How do we know when two stars at different distance away from us are the same type of star – e.g. Sun-like stars? Indeed, how do we know there are different types of stars The answer lies in the rainbow – or more precisely in the study of stellar spectra – and specifically, if a star has the same spectrum (absorption lines, etc…) as the Sun then it must be a Sun-like star
Radiation Laws The amount of EM energy that an object radiates into space is related to its temperature PHYSICS: heat flows from hot objects to cold objects – or, in other words, hot objects radiate more energy into space than colder ones The Second Law of Thermodynamics The actual amount emitted at a specific wavelength, however, is calculated in terms of an idealized object It’s da law Enter: Blackbody radiation theory
Blackbody Radiators Have a constant temperature T Radiate EM radiation into space at all wavelengths irrespective of size, shape, or composition With these somewhat idealized quantities a complete theoretical model linking together the flux and the temperature was developed by Max Planck at the turn of the 20th century Max Karl Ernst Ludwig Planck (1858 - 1947)
What Max Planck did: Developed an equation that described the way in which BBs radiate energy into space his equation describes the energy flux of a BB at a specific wavelength for a specified temperature The Planck equation – see it once and now forget it - unless you’re a Physics major “Sauron’s sneakers that’s an equation lad”
From experiments and Planck’s equation we get….. Line connecting ‘peaks’ of BBs of different temperature – moves to longer wavelengths as T decreases Energy flux Planck curve for BB of temperature T1 T1 T2 where T2 < T1 Wavelength
Temperature Definition: Temperature is a measure of heat energy heat energy is related to the motion of the molecules and atoms within a solid / liquid / gas hot gas molecules move around rapidly cool gas molecules move around slowly • Absolute zero temperature occurs at -273 oC • objects can get no colder than this - minimum energy state
The Kelvin Scale T(Kelvin) = T(Centigrade) + 273 Uses absolute zero as its starting point. Introduced by William Thomson ( Lord Kelvin: 1824 - 1907) OOTCTK Water boils at 373 K and freezes at 273 K On the Kelvin scale all temperatures are positive
The astronomers thermometer - a link between BBs and T Max flux BB of temperature T Wien’s law tells us how lmax varies with temperature T Energy flux lmax Wavelength lmax = the wavelength at which the maximum flux is radiated
Wien’s Law The wavelength (lmax) at which a BB emits the maximum amount of energy decreases with increasing temperature lmax T = 2.8977 x 10⁻³ units: lmax in meters, T in Kelvin Wilhelm Carl Werner Otto Fritz Franz Wien (1864 –1928) OOTETK
lmax ~ 500 nm is a fixed characteristic in the spectrum of sun-like stars Visible light UV Infrared
Observations: Maximum energy flux from Sun at lmax ~ 500 nm Note units:1 nm = 10-9 meters Wien’s law now allows us to calculate the Sun’s surface temperature T = (2.8977 x 10⁻³) / lmax = (2.8977 x 10⁻³ / (500 x 10-9) • another fundamental result for the Sun – it’s hot! T 5800 K
How hot is Vega? lmaxat 4600 Å So, Wien’s law tells us BB spectrum Vega is 500 K hotter than the Sun l (Å)
Wien’s law (in principle) gives us the temperature of any star anywhere in the Universe Globular cluster NGC 6752 – in Pavonis Distance ~ 13,000 light years
Pick a star – any star. How about # 5? NGC 6752 For star number 5 lmax = 4050 Å Using Wien’s law, we have T = 2.8977 x 10⁻³ / 4050 x 10-10 = 7173 K (1370 K hotter than ths Sun)
Stellar thermometer Summary Wien’s law lmax lmax T = 2.8977 x 10⁻³ Energy flux T(Kelvin) = T(Centigrade) + 273 Planck curve for BB of temperature T Wavelength lmax Planck curves – blackbody radiators
Kirchhoff’s laws 1859 – Gustav Kirchhoff argues that there are just three types of spectra Continuous (blackbody) spectra Hot solids, liquids or very dense gases EM radiation produced at all wavelengths Emission spectra Hot, low density gas EM radiation at very specific wavelengths Hot interstellar gas clouds produce such spectra Absorption spectra Produced when light from a continuous spectrum is viewed through a lower density, lower temperature gas Absorption lines, at very specific wavelengths, on top of a continuous spectrum Stars produce absorption line spectra
looking more closely at starlight Continuous spectrum Blackbody spectrum l stars Absorption line spectrum BB spectrum with ‘lines’ l Emission line spectrum l Interstellar medium
Spectral analysis is one of the most important topics in modern astronomy Temperature Spectral classification based on temperature variation of spectral lines Theoretical models Observations Graduate level class Spectral lines This is how we can recognizing similar stars
Stellar absorption lines Absorption line spectra produced by a blackbody radiator surrounded by a lower temperature gas envelope Hot, dense interior where the blackbody spectrum is formed Star Cool, low density envelope where the absorption lines form. Region known as the photosphere
Shape and “strength” of lines related to temperature Flux Continuum (from hot, dense interior) l EM waves at very specific wavelengths are absorbed by atoms in the star’s cooler outer envelope (photosphere). Hence: we don’t get to ‘see’ them with our telescope, and accordingly we see less than the expected BB spectrum flux and an absorption line is observed
Emission lines In general, emission lines are associated with hot low density gases Three processes are at work: High temperature many high energy collisions Collisions between atoms places them in an excited state (2) Between repeat collisions an excited atom releases a photon which carries away their excitation energy – and this produces an emission line Photon = burst – or packet - of EM radiation with energy E = h f
Uniquelythe same Stars classified according to hydrogen line characteristics Each kind of atom (hydrogen, helium, carbon, oxygen…) has its own unique set of absorption and emission lines
Red colour due to a excited hydrogen emission line Orion Star formation region
Spectral analysis Each type of atom has a unique set of absorption / emission lines They are the star equivalent of finger prints and DNA analysis, enabling us to find stars of the same temperature and composition So: can identify what stars are made of by looking at what absorption lines are present Stars are:~75% hydrogen, ~24% helium, and ~1% everything else
Spectral classification Classify stars according to their spectral lines key idea is to use ‘strength’ of hydrogen lines Cecilia Payne-Gaposhkin (1900 - 1979): 1925: Ph.D thesis shows hydrogen line strengths are related to temperature Annie Jump Cannon (1863 - 1941) studied over 250,000 spectra as part of the Harvard Observatory program to classify stars
spectrograph Record flux at each wavelength after starlight has passes trough prism Starlight in wavelength Flux Absorption lines Photograph of emission intensity
Balmer line transitions due to hydrogen These lines fall in the visible part of the EM spectrum – hence they can be seen with the eye / camera – historically this was important Hd Hg Hb Line strength strong I see spectra weak Johann Balmer (1825 – 1898)
Stellar Spectra Ca+ (H&K) Ha F Hb Hydrogen lines Ha G O (Sun) B K A Molecular lines UV IR Optical
The spectral classification scheme Sp type Temperature Comments (colour) O > 30,000 hottest and most B 10 - 30,000 luminous stars (blue) A 7,500 - 10,000 strongest hydrogen F 6,000 - 7,500 lines (blue-white) G 5,000 - 6000 Sun = G2 star (yellow) K 3,500 - 5000 coolest and least M < 3,500 luminous stars (red)
Recall - Why classify ? Spectral types: O B A F G K M Method is independent of distance Can recognize stars with the same intrinsic properties (temperature/luminosity/size): e.g., Sun-like stars = spectral type G2 Can now study specific specific groups of stars to study