Download
1 / 12
120 likes | 369 Views
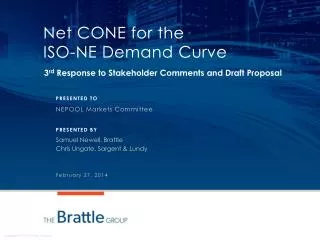
Net CONE for the ISO-NE Demand Curve. Second Response to Stakeholder Questions & Comments. NEPOOL Markets Committee. Sam Newell, Brattle Christopher Ungate , Sargent & Lundy. February 11, 2014. Stakeholder Questions/Comments. Framework for Selecting a Reference Technology. Objective

E N D
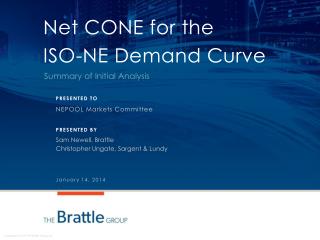
Net CONE for the ISO-NE Demand Curve Second Response to Stakeholder Questions & Comments NEPOOL Markets Committee Sam Newell, Brattle Christopher Ungate, Sargent & Lundy February 11, 2014
Framework for Selecting a Reference Technology • Objective • Estimate Net CONE that supports prices just high enough to attract sufficient new investment to maintain the long-term target reserve margin • Criteria for selecting the Reference Technology to meet the objective • Reliably able to help meet load when installed capacity is scarce • Complies with all environmental regulations • Dispatchable technology • Likely to be economic • Available as a utility-scale commercial plant • Lowest or near-lowest estimated Net CONE • Demonstrated commercial interest by developers • Can estimate Net CONE with low uncertainty • Cost estimates based on established technologies • Low E&AS uncertainty
Recent CT Builds • LMS100 builds since 2012 (16 turbines, 1,481 MW) • Rio Grande (TX) • Sentinel Energy Project (CA) • Walnut Creek Energy Park (CA) • Pueblo Airport Generation Station (CO) • LM6000 builds since 2012 (20 turbines, 920 MW) • Lonesome Creek Station (ND) • Pioneer Generation Station (MT) • Oxnard Peaker (CA) • Mariposa Energy (CA) • Almond Power Plant (CA) • Kearny Generating Station (NJ) • New Haven Harbor (CT) • F-class with SCR builds since 2012 (4 turbines, 800 MW) • Marsh Landing (CA)
5x16 Futures Projected to 2018/2019 • To project 2018/2019 electricity prices, we used electricity and gas futures over the next 12 months and extended them to 2018/2019 by maintaining a constant implied market heat rate and Algonquin Citygate basis differential Projected Gas and Electricity Prices
E&AS Margins for a CC • Historical Revenues Adjusted to Futures: (same as ORTP) • Estimate monthly historical 2010-13 E&AS net revenues using ISO-NE settlement data for like-units and our estimated fuel (Ventyx), emissions (RGGI), and VOM (S&L) costs • Project forward average 2010-13 monthly margins to 2018/2019 using the ratio of projected future 5x16 price to actual historical5x16price, where projections are based on an extension of available forwards: 2014 MHR * (2019 Hhub forwards + 2014 Basis Swaps escalated to 2019) • Projected 2018/2019 CC E&AS margin is $3.40/kW-mo • Adjusting the Algonquin Citygate adder by +/- 50% impacts margins by $0.47/kW-mo • Using only 2012/2013 data would result in projected E&AS margins that are lower by $1.03/kW-mo CC E&AS Margins
E&AS Margins for a CT • Methodology for LMS100 and Frame CT • Similar to CC, but exclude real-time and forward reserves since the historical unit-level data is unreliable due to portfolio allocations; will add back FRM based on price (see next slide) • Projected 2018/2019 LMS100 E&AS margin is $2.55/kW-mo • Adjusting the Algonquin Citygateadder by +/- 50% impacts margins by $0.42/kW-mo • Using only 2012-13 data would result in projected E&AS margins that are lower by $0.99/kW-mo • Projected 2018/2019 Frame CT E&AS margin is $1.84/kW-mobased on ratio of Frame CT-to-LMS100 revenues estimated from virtual dispatch (as there is limited data on like-units) LMS100 E&AS Margins
Forward Reserve Market (FRM) Revenues • The market is not very deep as one additional CT could shift the FRM supply curve and reduce prices from >$3/kW-mo back to 2011-12 levels • 2011/12 average price was $0.65/kW-mo; we project 2018/19 price of $1.02/kW-mo (escalating w/ projected energy prices) • We assume a new CT would offer 80% of capacity due to performance risks, which results in FRM revenues of $0.81/kW-mo for LMS100 and Frame CT (investigated that fast start has ≤ 1 min notification time) Source: http://www.iso-ne.com/markets/hstdata/mkt_offer_bid/fr_auctn_offrs/index.html Note: Winter 2013/14 price range is due to price separation between TMNSR and TMOR.
Peak Energy Rent (PER) Adjustment • Excess supply has prevented PER deductions • PER might become relevant when the capacity surplus goes away • PER adjustment occur when the LMPs exceed the PER strike price • PER Strike price = (higher of 1.07 x NY Harbor No. 2 Fuel Oil or Day-Ahead Algonquin City Gates) x 22,000 btu/kWh Heat Rate • We propose to estimate PER and add it to Net CONE • Depends on frequency of scarcity conditions • We will present our analysis and proposed adder on Feb 27
Averaging Two Reference Technologies • Suppose CCs and CTs are both entering in equilibrium, with the same Net CONE over several years but not in any individual year (always in slight disequilibrium) • Should Net CONE be set based on the technology with the minimum Net CONE in each year, switching reference technologies over time? • Even the technology with the lower myopic Net CONE shouldn’t enter at its myopic Net CONE since it will undercollect when the other technology enters and sets prices with a lower myopic Net CONE in some future years • Hence setting Net CONE at each year’s minimum could under-procure in every year • What if we choose a single technology and stick with it? • This works, but only if the other tech enters based on a reservation price equal to the Ref Tech’s myopic Net CONE, even when its own myopic Net CONE is much lower • May be hard to believe they would bid that much above their myopic Net CONE… • What if we set Net CONE equal to the average of the CT and CC Net CONEs? • May be closer to the price level where the most myopically-economic technology would enter • May be most likely to procure the right amount of capacity • Helps diversify potential administrative errors in Net CONE • The key question is whether both technologies are economic in the long term
Updated Net CONE Estimates • Current estimates shown below • The same as last time, except… • Updated E&AS estimates • Next steps • Consider adding PER estimate • Finalize electrical interconnection costs • Address remainder of stakeholder questions and comments from slide 1 (and further ones from today)