Download
1 / 1
10 likes | 160 Views
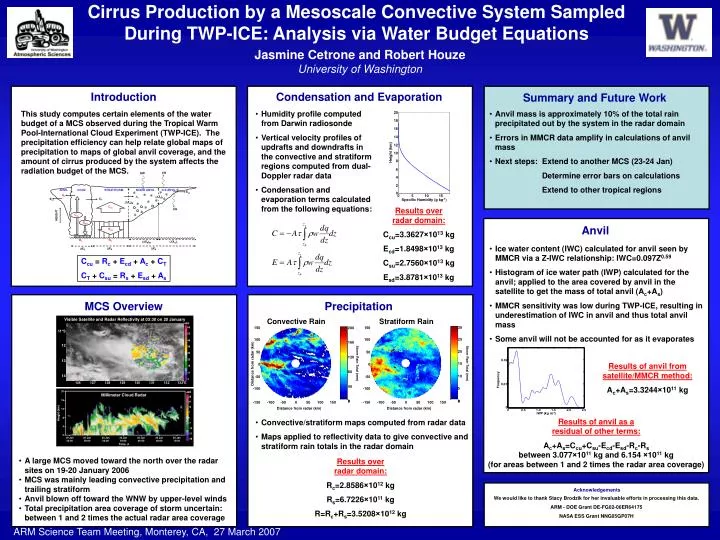
Cirrus Production by a Mesoscale Convective System Sampled During TWP-ICE: Analysis via Water Budget Equations. C su. E sd. LW. SW. *. ANVIL. CONV. STRATIFORM. MIXED ANVIL. ICE ANVIL. *. *. E se. *. *. *. A c. (D Z A ) I. A s. *. *. C T. E ce. *. *. (D Z A ) M. *. LW.

E N D
Cirrus Production by a Mesoscale Convective System Sampled During TWP-ICE: Analysis via Water Budget Equations Csu Esd LW SW * ANVIL CONV. STRATIFORM MIXED ANVIL ICE ANVIL * * Ese * * * Ac (DZA)I As * * CT Ece * * (DZA)M * LW * * HEIGHT Ccu Ecd Rc Rs (DXA)M (DXA)I DXS DXA DXC 30 150 150 200 25 100 100 160 20 50 50 120 15 Storm Rain Total (mm) Storm Rain Total (mm) 0 0 Distance from radar (km) 80 10 -50 -50 40 5 -100 -100 0 0 0 0 -150 -100 -50 0 50 100 150 -150 -100 -50 0 50 100 150 Distance from radar (km) Distance from radar (km) 0.02 Frequency 0.01 0 0 0.5 1.0 1.5 2.0 2.5 IWP (kg m-2) Jasmine Cetrone and Robert HouzeUniversity of Washington Introduction Condensation and Evaporation Summary and Future Work This study computes certain elements of the water budget of a MCS observed during the Tropical Warm Pool-International Cloud Experiment (TWP-ICE). The precipitation efficiency can help relate global maps of precipitation to maps of global anvil coverage, and the amount of cirrus produced by the system affects the radiation budget of the MCS. • Humidity profile computed from Darwin radiosonde • Vertical velocity profiles of updrafts and downdrafts in the convective and stratiform regions computed from dual-Doppler radar data • Condensation and evaporation terms calculated from the following equations: • Anvil mass is approximately 10% of the total rain precipitated out by the system in the radar domain • Errors in MMCR data amplify in calculations of anvil mass • Next steps: Extend to another MCS (23-24 Jan) • Determine error bars on calculations • Extend to other tropical regions 20 18 16 14 12 Height (km) 10 8 6 4 2 0 0 5 10 15 Specific Humidity (g kg-1) Results over radar domain: Ccu=3.3627×10¹³ kg Ecd=1.8498×10¹³ kg Csu=2.7560×10¹³ kg Esd=3.8781×10¹³ kg Anvil • Ice water content (IWC) calculated for anvil seen by MMCR via a Z-IWC relationship: IWC=0.097Z0.59 • Histogram of ice water path (IWP) calculated for the anvil; applied to the area covered by anvil in the satellite to get the mass of total anvil (Ac+As) • MMCR sensitivity was low during TWP-ICE, resulting in underestimation of IWC in anvil and thus total anvil mass • Some anvil will not be accounted for as it evaporates Ccu = Rc + Ecd + Ac + CT CT + Csu = Rs + Esd + As MCS Overview Precipitation Convective Rain Stratiform Rain Visible Satellite and Radar Reflectivity at 03:30 on 20 January dBZ 60 11°S 53 46 12 39 32 25 13 Results of anvil from satellite/MMCR method: Ac+As=3.3244×10¹¹ kg 18 11 14 4 126 127 128 129 130 131 132 133°E 20 dBZ Millimeter Cloud Radar 28 16 21 14 12 7 Height (km) 0 8 Results of anvil as a residual of other terms: Ac+As=Ccu+Csu-Ecd-Esd-Rc-Rs between 3.077×10¹¹ kg and 6.154 ×10¹¹ kg (for areas between 1 and 2 times the radar area coverage) • Convective/stratiform maps computed from radar data • Maps applied to reflectivity data to give convective and stratiform rain totals in the radar domain -7 4 -14 -21 0 19 Jan22:00 20 Jan00:00 20 Jan02:00 20 Jan04:00 20 Jan06:00 20 Jan08:00 20 Jan10:00 -28 Time • A large MCS moved toward the north over the radar sites on 19-20 January 2006 • MCS was mainly leading convective precipitation and trailing stratiform • Anvil blown off toward the WNW by upper-level winds • Total precipitation area coverage of storm uncertain: between 1 and 2 times the actual radar area coverage Results over radar domain: Rc=2.8586×10¹² kg Rs=6.7226×10¹¹ kg R=Rc+Rs=3.5208×10¹² kg Acknowledgements We would like to thank Stacy Brodzik for her invaluable efforts in processing this data. ARM - DOE Grant DE-FG02-06ER64175 NASA ESS Grant NNG05GP07H ARM Science Team Meeting, Monterey, CA, 27 March 2007