Download
1 / 35
350 likes | 508 Views
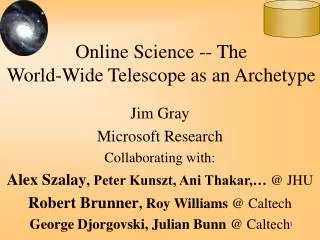
Online Science The World-Wide Telescope. Jim Gray, Alex Szalay Microsoft, Johns Hopkins Tamas Budavari, Tanu Malik Ani Thakar,… @ JHU George Djorgovski, Julian Bunn, Roy Williams @ Caltech. Outline. Overview of World-Wide Telescope Web Services as a federation scheme

E N D
Online Science The World-Wide Telescope Jim Gray, Alex Szalay Microsoft, Johns Hopkins Tamas Budavari, Tanu Malik Ani Thakar,… @ JHU George Djorgovski, Julian Bunn, Roy Williams @ Caltech
Outline • Overview of World-Wide Telescope • Web Services as a federation scheme • Sky Server as an example
ROSAT ~keV DSS Optical IRAS 25m 2MASS 2m GB 6cm WENSS 92cm NVSS 20cm IRAS 100m Why Is Astronomy Data Different? • It has no commercial value • No privacy concerns • Can freely share results with others • Great for experimenting with algorithms • It is real and well documented • High-dimensional data (with confidence intervals) • Spatial data • Temporal data • Many different instruments from many different places and many different times • Federation is a goal • The questions are interesting • How did the universe form? How does it work? • There is a lot of it (petabytes)
Virtual Observatory • Premise: Most data is (or could be online) • So, the Internet is the world’s best telescope: • It has data on every part of the sky • In every measured spectral band: optical, x-ray, radio.. • As deep as the best instruments (2 years ago). • It is up when you are up.The “seeing” is always great (no working at night, no clouds no moons no..). • It’s a smart telescope: links objects and data to literature on them.
Virtual ObservatoryData Federation of Web Services • Massive datasets live near their owners: • Near the instrument’s software pipeline • Near the applications • Near data knowledge and curation • Computer centers become Data Centers • Archives are replicated for • Performance • Availability/Reliability • Each Archive publishes a web service • Schema: documents the data • Methods on objects (queries) • Scientists get “personalized” extracts • Uniform access to multiple Archives • A common global schema
Time and Spectral DimensionsThe Multiwavelength Crab Nebulae Crab star 1053 AD X-ray, optical, infrared, and radio views of the nearby Crab Nebula, which is now in a state of chaotic expansion after a supernova explosion first sighted in 1054 A.D. by Chinese Astronomers. Graphic courtesy of Robert Brunner @ CalTech.
BJ RF IN J H K Even in “optical” images are very different Optical Near-Infrared Galaxy Image Mosaics BJ RF IN J H K One object in 6 different “color” bands Graphic courtesy of Robert Brunner @ CalTech.
Data in files FTP a local copy /subset.ASCII or Binary. Each scientist builds own analysis toolkit Analysis is tcl script of toolkit on local data. Some simple visualization tools: x vs y Data in a database Standard reports for standard things. Report writers for non-standard things GUI tools to explore data. Decision trees Clustering Anomaly finders Data Mining:Science vs Commerce
You can GREP 1 MB in a second You can GREP 1 GB in a minute You can GREP 1 TB in 2 days You can GREP 1 PB in 3 years. Oh!, and 1PB ~10,000 disks At some point you need indices to limit searchparallel data search and analysistools This is where databases can help You can FTP 1 MB in 1 sec You can FTP 1 GB / min (= 1 $/GB) … 2 days and 1K$ … 3 years and 1M$ But…some science is hitting a wallFTP and GREP are not adequate
Data Mining Algorithms Miners Scientists Science Data & Questions Database To store data Execute Queries Plumbers Question & AnswerVisualization Tools What’s needed?(not drawn to scale)
Outline • Overview of World-Wide Telescope • Web Services as a federation scheme • Sky Server as an example
Data Growth is Exponential • Astrophysical data is growing exponentially • Doubling every year (Moore’s Law+):both data sizes and number of data sets • Computational resources scale the same way • Constant $$$ will keep up with the data • Main problem is the software component • Currently components are not reused • Software costs are increasingly larger fraction • Aggregate costs are growing exponentially
Making Discoveries • When and where are discoveries made? • Always at the edges and boundaries • Going deeper, using more colors…. • Metcalfe’s law • Utility of computer networks grows as the number of possible connections: O(N2) • VO: Federation of N archives • Possibilities for new discoveries grow as O(N2) • Current sky surveys have proven this • Very early discoveries from SDSS, 2MASS, DPOSS
Publishing Data Roles Authors Publishers Curators Consumers Traditional Scientists Journals Libraries Scientists Emerging Collaborations Project www site Bigger Archives Scientists
Changing Roles • Exponential growth: • Projects last at least 3-5 years • Project data online during project lifetime. • Data sent to central archive only at the end of the project • At any instant, only 1/8 of data is centralized • More responsibility on projects • Becoming Publishers and Curators • Larger fraction of budget spent on software • Lot of development duplicated, wasted • More standards are needed • Easier data interchange, fewer tools • More templates are needed • Develop less software on your own
Emerging New Concepts • Standardizing distributed data • Web Services, supported on all platforms • Custom configure remote data dynamically • XML: Extensible Markup Language • SOAP: Simple Object Access Protocol • WSDL: Web Services Description Language • Standardizing distributed computing • Grid Services • Custom configure remote computing dynamically • Build your own remote computer, and discard • Virtual Data: new data sets on demand
NVO: How Will It Work? • Define commonly used “core” services • Build higher level toolboxes/portals on top • We do not build “everything for everybody” • Use the 90-10 rule: • Define the standards and interfaces • Build the framework • Build the 10% of services that are used by 90% • Let the users build the rest from the components
Web Services: The Key? Your program Web Server http • Web SERVER: • Given a url + parameters • Returns a web page (often dynamic) • Web SERVICE: • Given a XML document (soap msg) • Returns an XML document • Tools make this look like an RPC. • F(x,y,z) returns (u, v, w) • Distributed objects for the web. • + naming, discovery, security,.. • Internet-scale distributed computing Web page Your program Web Service soap Data In your address space objectin xml
Core Services • Metadata information about resources • Waveband • Sky coverage • Translation of names to universal dictionary (UCD) • Simple search patterns on the resources • Cone Search • Image mosaic • Unit conversions • Simple filtering, counting, histogramming • On-the-fly recalibrations
Higher Level Services • Built on Core Services • Perform more complex tasks • Examples • Automated resource discovery • Cross-identifications • Photometric redshifts • Outlier detections • Visualization facilities • Expectation: • Build custom portals in matter of days from existing building blocks (like today in IRAF or IDL)
SkyQuery: Experimental Federation • Federated 5 Web Services • Portal unifies 3 archives and a cutout service to visualize results • Fermilab/SDSS, JHU/FIRST, Caltech/2MASS Archives • Multi-survey spatial join and SQL select • Distributed query optimization (T. Malik, T. Budavari) in 6 weeks http://www.skyquery.net/ • Cutout web service: annotated SDSS images • http://SkyService.jhu.pha.edu/SdssCutout SELECT o.objId, o.ra, o.r, o.type, t.objId FROM SDSS:PhotoPrimary o, TWOMASS:PhotoPrimary t WHERE XMATCH(o,t)<3.5 AND AREA(181.3,-0.76,6.5) AND o.type=3 AND o.I – t.m_j > 2
SkyQuery • Distributed Query tool using a set of services • Feasibility study, built in 6 weeks from scratch • Tanu Malik (JHU CS grad student) • Tamas Budavari (JHU astro postdoc) • Implemented in C# and .NET • Won 2nd prize of Microsoft XML Contest • Allows queries like: SELECT o.objId, o.r, o.type, t.objId FROM SDSS:PhotoPrimary o, TWOMASS:PhotoPrimary t WHERE XMATCH(o,t)<3.5 AND AREA(181.3,-0.76,6.5) AND o.type=3 and (o.I - t.m_j)>2
Architecture Web Page Image cutout SkyQuery SkyNodeSDSS SkyNode2Mass SkyNodeFirst
SkyNode • Metadata functions (SOAP) • Info, Tables, Columns, Schema, Functions, Keysearch • Query functions (SOAP) • Dataset Query(String sqlCmd) • Dataset Xmatch(Dataset input, String sqlCmd, float eps) • Database • MS SQL Server • Upload dataset • Very fast spatial search engine (HTM-based)crossmatch takes <3 ms/object over 15M in SDSS • User defined functions and stored procedures
SkyQuery SkyNode 1 SkyNode 2 SkyNode 3 Data Flow query http://www.skyquery.net
Outline • Overview of World-Wide Telescope • Web Services as a federation scheme • Sky Server as an example
Scenario Design • Astronomers proposed 20 questions • Typical of things they want to do • Each would require a week of programming in tcl / C++/ FTP • Goal, make it easy to answer questions • DB and tools design motivated by this goal • Implemented utility procedures • JHU Built Query GUI for Linux /Mac/.. clients
Q11: Find all elliptical galaxies with spectra that have an anomalous emission line. Q12: Create a grided count of galaxies with u-g>1 and r<21.5 over 60<declination<70, and 200<right ascension<210, on a grid of 2’, and create a map of masks over the same grid. Q13: Create a count of galaxies for each of the HTM triangles which satisfy a certain color cut, like 0.7u-0.5g-0.2i<1.25 && r<21.75, output it in a form adequate for visualization. Q14: Find stars with multiple measurements and have magnitude variations >0.1. Scan for stars that have a secondary object (observed at a different time) and compare their magnitudes. Q15: Provide a list of moving objects consistent with an asteroid. Q16: Find all objects similar to the colors of a quasar at 5.5<redshift<6.5. Q17: Find binary stars where at least one of them has the colors of a white dwarf. Q18: Find all objects within 30 arcseconds of one another that have very similar colors: that is where the color ratios u-g, g-r, r-I are less than 0.05m. Q19: Find quasars with a broad absorption line in their spectra and at least one galaxy within 10 arcseconds. Return both the quasars and the galaxies. Q20: For each galaxy in the BCG data set (brightest color galaxy), in 160<right ascension<170, -25<declination<35 count of galaxies within 30"of it that have a photoz within 0.05 of that galaxy. Q1: Find all galaxies without unsaturated pixels within 1' of a given point of ra=75.327, dec=21.023 Q2: Find all galaxies with blue surface brightness between and 23 and 25 mag per square arcseconds, and -10<super galactic latitude (sgb) <10, and declination less than zero. Q3: Find all galaxies brighter than magnitude 22, where the local extinction is >0.75. Q4: Find galaxies with an isophotal surface brightness (SB) larger than 24 in the red band, with an ellipticity>0.5, and with the major axis of the ellipse having a declination of between 30” and 60”arc seconds. Q5: Find all galaxies with a deVaucouleours profile (r¼ falloff of intensity on disk) and the photometric colors consistent with an elliptical galaxy. The deVaucouleours profile Q6: Find galaxies that are blended with a star, output the deblended galaxy magnitudes. Q7: Provide a list of star-like objects that are 1% rare. Q8: Find all objects with unclassified spectra. Q9: Find quasars with a line width >2000 km/s and 2.5<redshift<2.7. Q10: Find galaxies with spectra that have an equivalent width in Ha >40Å (Ha is the main hydrogen spectral line.) The 20 Queries Also some good queries at: http://www.sdss.jhu.edu/ScienceArchive/sxqt/sxQT/Example_Queries.html
DR1 100 M Photo 400 K specta Two kinds of SDSS data in an SQL DB(objects and images all in DB) • 15M Photo Objects ~ 400 attributes 50K Spectra with ~30 lines/ spectrum
Q15: Fast Moving Objects • SELECT r.objID as rId, g.objId as gId, • dbo.fGetUrlEq(g.ra, g.dec) as url • FROM PhotoObj r, PhotoObj g • WHERE r.run = g.run and r.camcol=g.camcol and abs(g.field-r.field)<2 -- nearby • -- the red selection criteria • and ((power(r.q_r,2) + power(r.u_r,2)) > 0.111111 ) • and r.fiberMag_r between 6 and 22 and r.fiberMag_r < r.fiberMag_g and r.fiberMag_r < r.fiberMag_i • and r.parentID=0 and r.fiberMag_r < r.fiberMag_u and r.fiberMag_r < r.fiberMag_z • and r.isoA_r/r.isoB_r > 1.5 and r.isoA_r>2.0 • -- the green selection criteria • and ((power(g.q_g,2) + power(g.u_g,2)) > 0.111111 ) • and g.fiberMag_g between 6 and 22 and g.fiberMag_g < g.fiberMag_r and g.fiberMag_g < g.fiberMag_i • and g.fiberMag_g < g.fiberMag_u and g.fiberMag_g < g.fiberMag_z • and g.parentID=0 and g.isoA_g/g.isoB_g > 1.5 and g.isoA_g > 2.0 • -- the matchup of the pair • and sqrt(power(r.cx -g.cx,2)+ power(r.cy-g.cy,2)+power(r.cz-g.cz,2))*(10800/PI())< 4.0 • and abs(r.fiberMag_r-g.fiberMag_g)< 2.0 • Find near earth asteroids: • Finds 3 objects in 11 minutes • (or 52 seconds with an index) • Ugly, but consider the alternatives (c programs and files and time…)
Performance (on current SDSS data) • Run times: on 15k$ HPServer (2 cpu, 1 GB , 8 disk) • Some take 10 minutes • Some take 1 minute • Median ~ 22 sec. • Ghz processors are fast! • (10 mips/IO, 200 ins/byte) • 2.5 m rec/s/cpu ~1,000 IO/cpu sec ~ 64 MB IO/cpu sec
Demo of SkyServer • Based on the TerraServer design • Designed for high school students • Contains 150 hours of interactive courses • Experiment for easy visual interfaces • Opened June 5, 2001 • After a year: • 1.6M page views • 60K visitors • 4.7M page hits • Added Web Services • Cutout • SkyQuery http://skyserver.sdss.org/
Outline • Overview of World-Wide Telescope • Web Services as a federation scheme • Sky Server as an example
Relevant Papers • Data Mining the SDSS SkyServer DatabaseJim Gray; Peter Kunszt; Donald Slutz; Alex Szalay; Ani Thakar; Jan Vandenberg; Chris Stoughton Jan. 2002 40 p. • An earlier paper described the Sloan Digital Sky Survey’s (SDSS) data management needs [Szalay1] by defining twenty database queries and twelve data visualization tasks that a good data management system should support. We built a database and interfaces to support both the query load and also a website for ad-hoc access. This paper reports on the database design, describes the data loading pipeline, and reports on the query implementation and performance. The queries typically translated to a single SQL statement. Most queries run in less than 20 seconds, allowing scientists to interactively explore the database. This paper is an in-depth tour of those queries. Readers should first have studied the companion overview paper “The SDSS SkyServer – Public Access to the Sloan Digital Sky Server Data” [Szalay2]. • SDSS SkyServer–Public Access to Sloan Digital Sky Server DataJim Gray; Alexander Szalay; Ani Thakar; Peter Z. Zunszt; Tanu Malik; Jordan Raddick; Christopher Stoughton; Jan Vandenberg November 2001 11 p.: Word 1.46 Mbytes PDF 456 Kbytes • The SkyServer provides Internet access to the public Sloan Digital Sky Survey (SDSS) data for both astronomers and for science education. This paper describes the SkyServer goals and architecture. It also describes our experience operating the SkyServer on the Internet. The SDSS data is public and well-documented so it makes a good test platform for research on database algorithms and performance. • The World-Wide TelescopeJim Gray; Alexander Szalay August 2001 6 p.: Word 684 Kbytes PDF 84 Kbytes • All astronomy data and literature will soon be online and accessible via the Internet. The community is building the Virtual Observatory, an organization of this worldwide data into a coherent whole that can be accessed by anyone, in any form, from anywhere. The resulting system will dramatically improve our ability to do multi-spectral and temporal studies that integrate data from multiple instruments. The virtual observatory data also provides a wonderful base for teaching astronomy, scientific discovery, and computational science. • Designing and Mining Multi-Terabyte Astronomy Archives Robert J. Brunner; Jim Gray; Peter Kunszt; Donald Slutz; Alexander S. Szalay; Ani ThakarJune 1999 8 p.: Word (448 Kybtes) PDF (391 Kbytes) • The next-generation astronomy digital archives will cover most of the sky at fine resolution in many wavelengths, from X-rays, through ultraviolet, optical, and infrared. The archives will be stored at diverse geographical locations. One of the first of these projects, the Sloan Digital Sky Survey (SDSS) is creating a 5-wavelength catalog over 10,000 square degrees of the sky (see http://www.sdss.org/). The 200 million objects in the multi-terabyte database will have mostly numerical attributes in a 100+ dimensional space. Points in this space have highly correlated distributions. • The archive will enable astronomers to explore the data interactively. Data access will be aided by multidimensional spatial and attribute indices. The data will be partitioned in many ways. Small tag objects consisting of the most popular attributes will accelerate frequent searches. Splitting the data among multiple servers will allow parallel, scalable I/O and parallel data analysis. Hashing techniques will allow efficient clustering, and pair-wise comparison algorithms that should parallelize nicely. Randomly sampled subsets will allow de-bugging otherwise large queries at the desktop. Central servers will operate a data pump to support sweep searches touching most of the data. The anticipated queries will re-quire special operators related to angular distances and complex similarity tests of object properties, like shapes, colors, velocity vectors, or temporal behaviors. These issues pose interesting data management challenges. • TeraScale SneakerNet: Using Inexpensive Disks for Backup, Archiving, and Data Exchange
References and Links • SkyServer • http://skyserver.sdss.org/ • http://research.microsoft.com/pubs/ • Virtual Observatory • http://www.us-vo.org/ • http://www.voforum.org/ • World-Wide Telescope • paper in ScienceV.293 pp. 2037-2038. 14 Sept 2001. (MS-TR-2001-77 word or pdf.) • SDSS DB is a data mining challenge: • Get your personal copy athttp://research.microsoft.com/~gray/sdss