Download
1 / 67
700 likes | 933 Views
The Output Market. “ national accounts leave out a crucial dimension of the economy – the part that exists outside the realm of monetary exchange. ”. The output market.

E N D
The Output Market “national accounts leave out a crucial dimension of the economy – the part that exists outside the realm of monetary exchange.”
The output market The output market has two of the macro variables that are most often used as indicators of the economy’s performance – GDP and the inflation rate. In fact GDP was traditionally the measure used to determine when the economy was in a recession. In this unit we look at the strengths and weaknesses of these measures plus the track record so you will be looking at a lot of graphs. We will also look at some alternatives to GDP that have surfaced in recent years. The Consumer Price Index (CPI) is the statistic we use to measure inflation, and here we will look at what it is, the track record, and the controversy over Social Security and the CPI adjustement, As a starter, consider to question; When would you want to be born – into the world in your time, your parents’ time, or that of your grandparents – and what would be the factor that most affects your decision?
In the news • “’Are you better off?’ The answer is less clear than it was in 1980.” • “Why do we still care about the Dow?” • “GDP fetishism” • “Paradox of ‘94: Gloomy voters in good times” • “Whose economy is it anyway?” • “Grossly distorted picture” • “Life is better; It isn’t better. Which is it?” • “Is inflation dead?”“Inflation is dead” • “Commodity prices spell inflation danger” • “The Boskin Commission’s trillion dollar fantasy”
Output Market We are talking markets here, so we have… • Measures of Quantity (Q = GDP) • Adjustment for prices (real v nominal) • Measures of Price (CPI / inflation) • Limitations of measures • What should count / • What should not count • Track record (GDP CPI) • Trends • Cycles • Composition • Alternatives U* P =W Headlines P* Q* Q = E
Question: When & where to Live Who has it best – and how do you decide?
Some possible factors affecting the choice • Health (blood letting, diseases, life expectancy, height, Novocain) • "he was bled till symptoms of fainting came on. • Living conditions (central heat, indoor plumbing, electricity, recreation (music)) • "Would you like to hear some music?” • Family life (“toys,” # children, divorce, education, retirement, entertainment) -”The typical working-class mother of the 1890's, married in her teens or early twenties and experiencing ten pregnancies, spent about fifteen years in a state of pregnancy and in nursing” • Purchasing ‘power’
Total number of births per woman if she experienced the current period age-specific fertility rates throughout her life Michael Haines, “Fertility and Mortality in the United States,” EH.net
Is there an indicator of progress? At least it is correlated with some of the factors you thought were important in your choice
What do you see here and in the next graph? Richard Steckel, "Biological Measures of the Standard of Living," JEP, Winter 2008
Output Measure: GDP Gross Domestic Product (GDP) is a measure of a country’s economic output and there are many adjustments made to account for changes in prices, size of the population, and cost of living. Also, there are alternative ways to measure size – by how much we produce, how much we earn, or how much we spend. They all give the same number – GDP – and we use the spending one most often. We also look at some of the weaknesses of GDP as a policy goal.
Output Measure: GDP GDP (Current value or nominal) Definition: the market value of final goods and services produced annually within a country. This is computed by adding up the money spent on all currently produced goods and services in a year. If you do not buy it ( stay at home parent), it is not here and if you buy it and it was not produced this year (used car, corporate stock), it is not here.
+ + + + + + = GDP +
Related measures Real GDP:(Constant $ GDP) GDP adjusted for changes in prices / value of money. Used when we want to see how a country does over time. PPP GDP (Purchasing Power Parity): GDP adjusted for differences in the cost of living in countries. We use this when we want to make international comparisons. GDP (US$): GDP adjusted for differences in the value of currencies so all GDP figures are in US$s. We use this when we want to make international comparisons. China looks bigger with this than the PPP measure because prices are lower in China.
Related measures Per capita GDP: GDP divided by population. This gives us a measure of standard of living. China has the second largest economy in the world based on GDP, but it is a poor country when we look at GDP per capita because all of that production is divided among the 1.3 billion people. Or Austria is way down he list of countries ranked by GDP, but it is near the top when measured by GDP per capita.
GDP in “Pictures” Now you will see a number of graphs and tables. With that pad of paper make sure you take some notes on what you see in the diagrams. Look for trends, cycles, and changes in trends or cycles. In the Real GDP graph you can barely see the Great Depression and W II, and the shape of the curve is similar to what we would see with a constant growth rate. In the Annual% change graph you see a pattern of good (Positive values) years and bad years (negative values), but there is a difference between those before and after WW II In the two column graphs you see the impact that the adjustment for inflation can make. Look at the difference in the 1970s and be sure you can explain it – and then you will understand why the country took an ideological shift after that decade.
Why the BIG difference in the 1970s between this and next graph?
Consumption ( C ) Durables Nondurables Services Investment ( I ) Fixed investment Residential Nonresidential Structures Producers’ durables Inventory investment Government ( G ) Federal State & Local Net Exports (X-M) Exports ( X ) Imports ( M ) Decomposition of GDP Look at the next graph and jot down what you see
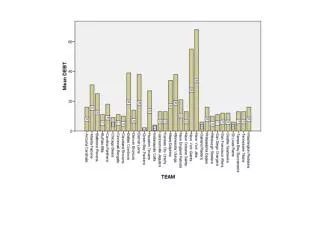
International Comparisons Is the US “different?” Look at the next graphs and tables and jot down what you see is “different” about the US – and how are China and the US different?
Why the big change in China, Germany, and Mexico? What does the difference between Germany and US 2008 columns mean?
Some observations • Why the big change in China and Mexico? What does the difference between China and US columns mean? China and Mexico initially had a far bigger share of their people living/working on farms. • Why the big change in China, Germany, and Mexico? What does the difference between Germany and US 2008 columns mean? the difference between China and US columns mean? This is the growth in their international trade – and trade is more important in China than the US • What explains the difference between Japan and China? Japan did its industrialization right after the war – Chinas was more recent and Japan’s service sector is now growing faster • What does this tell us about China v US? That China’s people save far more than Americans.
IMF Real GDP Growth (% change)
Output / GDP “a nation’s well-being depends on many factors ignored by GDP, such as leisure time, income inequality and quality of the environment.”"Measuring economies: Grossly distorted picture," The Economist 2/11/2006
Limitations of GDP • Bads • Crime • Pollution • Nonmarket activities • Underground economy • Leisure • Inequality • Infrastructure • Resource depletion • Measurement • New Goods and Quality Changes • Service Sector and Government These are some of the potential limitations of GDP as a measure of welfare – of why bigger is not necessarily better
Leisure: Average annual workweek We work more hours
Is bigger better? • “By the standard of the GDP, the worst families in America are those that actually function as families – they cook their own meals, take walks after dinner, and talk together instead of just farming the kids out to the commercial culture. …It is not accidental that the two major protest movements of recent decades – environmentalists and pro-family – both deal with parts of the real economy that GDP leaves out and that the commercial culture that embodies GDP tends to avoid.”Rowe • TED talk “It is a story about us, people, being persuaded to spend money we don’t have on things we don’t need, to create impressions that won’t last on people we don’t care about.”Rowe
Is bigger better? • “How did it happen that the nation’s economic hero is a terminal cancer patient going through a costly divorce?”Rowe • “GDP not only masks the breakdown of the social structure and the natural habitat upon which the economy – and life itself – ultimately depend; worse, it actually portrays such breakdown as economic gain”Rowe • “Expenditure is a means, not an end, and to assess the health of an agency, or system, you need to know what it has accomplished, not just what motion it has generated and money it has spent.”Rowe • “the assumption that every purchase is beneficial simply because someone has paid the price.”Rowe
What is wrong with this picture? One is a happily married woman (man) who goes home after work to her husband (his wife). Both may go home after a working day. They get pleasure from cooking their gourmet meal together, using ingredients which they have grown in their garden, and which they follow by a quiet evening reading together. The net contribution to GDP is the value of the few ingredients in their meal that they had to purchase and the cost of the books. By contrast, the lonely bachelor eats an unhealthy meal at a fast food restaurant, then goes to a bar where he drinks excessively as solace for his loneliness, visits a prostitute, and then wrecks his car while driving back home, taking a taxi the remaining distance. “The Commission on the Measurement of Economic Performance and Social Progress” established 2008 by Sarkozy
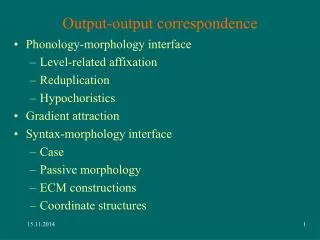
Three approaches to creating alternatives to GDP Modify GDP Green GDP, Genuine Progress Inidicator Direct measure of well-being Happiness index Composite indexes Human development index Happy planet index
Approaches to creating alternatives to GDP Modify GDP Measure of Economic Welfare Index of Sustainable Economic Welfare Genuine Progress Indicator Green GDPs Adjusted Net Savings Genuine Wealth
Approaches to creating alternatives to GDP 2. Direct measure of well-being Ecological footprint Subjective happiness Gross National Happiness (Bhutan in early 1980s) World Database of Happiness is a compilation of studies and data related to happiness and satisfaction surveys
Beyond GDP: The Need for New Measures of Progress, BU, THE PARDEE PAPERS / No. 4 / January 2009
Some efforts 2008 President Sarkozy of Franceestablishes Commission on the Measurement of Economic Performance and Social Progress suggests 3 alternatives to GDP Subjective measure (how do you ‘feel’?) Objective measure (health, education, balance of time, political voice, social connections, environmental conditions, personal insecurity) Sustainability http://www.stiglitz-sen-fitoussi.fr/en/index.htm 2010 Prime Minister David Cameron of England proposes Office of National Statistics measure country’s ‘general well-being’(GWB) to complement GDP