Download
1 / 20
200 likes | 288 Views
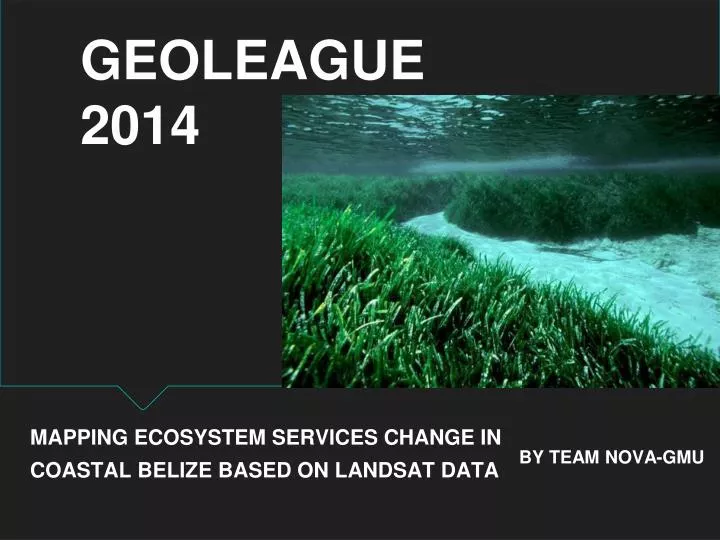
GEOLEAGUE 2014. MAPPING ECOSYSTEM SERVICES CHANGE IN COASTAL BELIZE BASED ON LANDSAT DATA. BY TEAM NOVA-GMU. Meet the Team. Semesters of experience. Overview. Background Methods Results Discussion Summary. --Ecosystem service --Belize fisheries and habitat links

E N D
GEOLEAGUE 2014 MAPPING ECOSYSTEM SERVICES CHANGE IN COASTAL BELIZE BASED ON LANDSAT DATA BY TEAM NOVA-GMU
Meet the Team Semesters of experience
Overview Background Methods Results Discussion Summary --Ecosystem service --Belize fisheries and habitat links --Landsat collection and classification --Benefit transfer --Classified habitats --Habitat value changes --Habitat losses --Policy suggestions --Data limitations
Ecosystem Valuation • Ecosystem services support human populations • Value of services often not considered in economies
Belize Fisheries • Coastal zone revenue ~$1400 mil (US$) • Capture fisheries are ~3% of GDP; • Dominated by export of Spiny Lobster (Panulirusargus), Queen Conch (Strombusgigas) and pink shrimp (Penaeussp.) • Export revenue: $48.7 mil (2013 US$)
Belize Habitats • Seagrass and mangroves provide habitat for breeding, nursery, and feeding areas • Threats to mangroves • development • sedimentation changes • Threats to seagrass • salinity and pH changes • sedimentation • eutrophication
Methods: Imagery Level 1T images downloaded from USGS Earth Explorer Study area: ~90% of coastal population ~80% of seagrass ~45% of mangrove
Methods: Classification Coral Open Sea Sea Grass Urban Area Belize City Forest Agricultural • Training areas were created over each land cover type and grown to 30 pixel area regions using ERDAS Imagine Region Grow Tool • Minimum Distance Supervised Classification-64% accuracy • Accuracy Assessment Using Google Earth comparison • Raster to Polygon with Majority Filter and Boundary Clean
Results 1980 2013
Methods: Benefit transfer • Apply habitat specific per-area values from similar study sites • Transfer function relating value to habitat parameters preferable; lack of enough comparable sources • 9 mangrove, 3 seagrass transfer value studies • literature and database • applied median values to Belize habitat areas
Discussion: Habitat valuation • Underestimation of seagrass and mangrove contribution to Belize capture fisheries • 2006 fishery export income total: $48.7 mil (2013 US$) • 2013 benefit transfer estimation: $28.5 mil (2013 US$) • Subsistence and recreational fishing support from seagrass mangroves not considered
Discussion: Policy Suggestions • Reduce terrestrial impact on coastal zone • sediment barriers • riparian restoration • waste treatment • Increase marine protection zone extent
Discussion: Data limitations • Landsat Data • Resolution and bands, 1980 to 2013 • Occlusions, artifacts, cloud cover • Data sources and accessibility • Need for ground truthing, different RS sources
Summary • Capture fisheries consisting of conch, finfish, and lobster are a vital part of Belize’s economy • The value of the coastal ecosystems can be calculated in correlation with its area and the quantity of marine life caught for food • Marine environments can be classified using Landsat imagery, but it is important to have ancillary data and a more thorough classification using hyperspectral reflectance signatures • The 12% decline of the seagrass yields $3.4 million loss of habitat value • The 50% increase in urban areas and dramatic increase in population contributes to the pollution of the marine environment through the flow of waste products from impervious surfaces • To slow the decline of the habitats, it is recommended to reduce terrestrial impact and increase marine protection zone extent
Acknowledgements • Dr. Michael Krimmer • Greg Bacon • Dr. Kenneth Rasmussen • Mauro Gongora, Fisheries Officer, Belize Fisheries Department