Download
1 / 12
0 likes | 2 Views
Data-driven decision making: In the era of big data, organizations are increasingly relying on data-driven approaches to make informed decisions, optimize processes, and gain competitive advantages. Statistics and probability play a crucial role in extracting meaningful insights from data.<br>Extracting insights from data: Statistical methods and probability concepts are essential tools for analyzing and interpreting data, enabling data scientists to uncover patterns, trends, and relationships that may not be immediately apparent.<br>

E N D
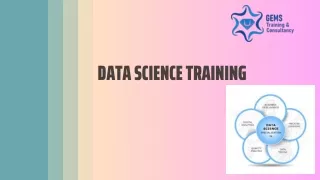
Introduction Data-driven decision making: In the era of big data, organizations are increasingly relying on data-driven approaches to make informed decisions, optimize processes, and gain competitive advantages. Statistics and probability play a crucial role in extracting meaningful insights from data. Extracting insights from data: Statistical methods and probability concepts are essential tools for analyzing and interpreting data, enabling data scientists to uncover patterns, trends, and relationships that may not be immediately apparent. Statistical methods in data analysis: Descriptive statistics, inferential statistics, hypothesis testing, regression analysis, and time series analysis are among the statistical techniques used to explore, summarize, and draw conclusions from data. Probability concepts in machine learning: Probability distributions, Bayesian inference, and sampling techniques are fundamental concepts in machine learning algorithms, enabling the development of predictive models and intelligent systems. Importance of statistical thinking: Statistical thinking involves the application of statistical principles and methods to critically evaluate data, make data-driven decisions, and communicate findings effectively.
Descriptive Statistics Measures of central tendency (mean, median, mode): These measures provide a summary of the central or typical value in a dataset, helping to understand the distribution and identify potential outliers. Measures of dispersion (range, variance, standard deviation): These measures quantify the spread or variability of data points around the central value, providing insights into the distribution's shape and concentration. Data visualization techniques (histograms, box plots, scatter plots): Visual representations of data using charts, plots, and graphs facilitate the exploration and communication of patterns, trends, and relationships within the data. Identifying patterns and trends: Descriptive statistics and data visualization techniques aid in recognizing recurring patterns, cyclical behaviors, and underlying trends in the data, which can inform further analysis and decision-making. Outlier detection and treatment: Statistical methods, such as interquartile range (IQR) and z-scores, are used to identify and handle outliers, which can significantly impact statistical analysis and model performance.
Probability Fundamentals Sample space and events: The sample space represents all possible outcomes of an experiment or observation, while events are specific subsets of the sample space of interest. Mutually exclusive and independent events: Mutually exclusive events cannot occur simultaneously, while independent events do not influence the occurrence of one another, allowing for the calculation of compound probabilities. Conditional probability: Conditional probability quantifies the likelihood of an event occurring given that another event has already occurred, providing a way to update probabilities based on new information. Bayes' theorem: Bayes' theorem is a fundamental principle in probability theory, allowing for the calculation of conditional probabilities and the revision of prior beliefs based on new evidence or data. Random variables (discrete and continuous): Random variables are numerical quantities that represent the outcomes of random experiments, with discrete variables taking on countable values and continuous variables taking on values within a range.
Hypothesis Testing Null and alternative hypotheses: The null hypothesis represents a claim about a population parameter or the status quo, while the alternative hypothesis is the competing claim or research hypothesis of interest. Types of errors (Type I and Type II): Type I error occurs when the null hypothesis is incorrectly rejected, while Type II error occurs when the null hypothesis is incorrectly accepted, leading to potential consequences in decision-making. Significance level and p-value: The significance level (alpha) determines the threshold for rejecting the null hypothesis, while the p-value represents the probability of observing data as extreme or more extreme than the current data, assuming the null hypothesis is true. One-sample and two-sample tests: One-sample tests evaluate a single population parameter against a hypothesized value, while two-sample tests compare parameters between two independent populations or groups. Parametric and non-parametric tests: Parametric tests make assumptions about the underlying distribution of the data, while non-parametric tests do not rely on such assumptions and are often used when the assumptions are violated or the data is ordinal or ranked.
Correlation and Regression Analysis Correlation coefficient (Pearson's, Spearman's): The correlation coefficient measures the strength and direction of the linear relationship between two variables, with Pearson's coefficient used for continuous variables and Spearman's coefficient used for ordinal or ranked data. Simple linear regression: Simple linear regression models the relationship between a single independent variable (predictor) and a dependent variable (response) using a straight line, allowing for prediction and inference. Multiple linear regression: Multiple linear regression extends simple linear regression by incorporating multiple independent variables to model and predict a single dependent variable, enabling the analysis of more complex relationships. Assumptions and diagnostics: Regression analysis relies on assumptions such as linearity, normality, homoscedasticity, and independence of errors, which must be checked and validated through diagnostic techniques. Model evaluation and selection: Various metrics, such as R-squared, adjusted R-squared, and F-statistics, are used to evaluate the goodness of fit and performance of regression models, while techniques like variable selection and regularization aid in model selection.
Time Series Analysis Components of a time series (trend, seasonality, cyclicity): Time series data often exhibits patterns such as long-term trends, periodic seasonality, and cyclical fluctuations, which must be identified and accounted for in the analysis. Stationarity and differencing: Stationarity is a desirable property in time series analysis, where the statistical properties of the data remain constant over time. Differencing techniques can be used to transform non-stationary data into stationary data. Autocorrelation and partial autocorrelation: Autocorrelation measures the correlation between observations at different time lags, while partial autocorrelation quantifies the direct correlation between observations after accounting for intermediate lags. ARIMA models: Autoregressive Integrated Moving Average (ARIMA) models are a widely used class of models for forecasting and analyzing time series data, combining autoregressive (AR) and moving average (MA) components with differencing to handle non-stationarity. Forecasting methods (exponential smoothing, ARIMA): Exponential smoothing and ARIMA models are popular forecasting techniques used to predict future values of a time series based on its historical data and patterns.
Probability Distributions in Machine Learning Gaussian (Normal) distribution: The normal distribution is a continuous probability distribution that is widely used in machine learning due to its well-understood properties and the central limit theorem. It is often assumed for continuous variables in regression and generative models. Bernoulli and Binomial distributions: The Bernoulli distribution models a single binary outcome, while the binomial distribution models the number of successes in a fixed number of independent Bernoulli trials, making them relevant in classification problems and discrete event modeling. Multinomial and Categorical distributions: The multinomial distribution models the probability of counts or frequencies across multiple categories, while the categorical distribution is a special case for a single draw from multiple categories, applied in multi-class classification and natural language processing. Poisson distribution: The Poisson distribution models the number of events occurring in a fixed interval of time or space, useful for modeling rare events, count data, and applications like website traffic analysis and queuing systems. Exponential and Gamma distributions: The exponential distribution models the time between independent events, while the gamma distribution is a generalization of the exponential and is used to model waiting times, reaction rates, and other positive continuous variables.
Bayesian Statistics Bayes' theorem and Bayesian inference: Bayes' theorem provides a framework for updating prior beliefs about unknown parameters or hypotheses based on observed data, enabling Bayesian inference and probabilistic reasoning. Prior and posterior distributions: In Bayesian analysis, prior distributions represent the initial beliefs or assumptions about the parameters before observing data, while posterior distributions represent the updated beliefs after incorporating the observed data. Conjugate priors: Conjugate priors are families of prior distributions that, when combined with the likelihood function, result in a posterior distribution from the same family, simplifying calculations and enabling analytical solutions in certain cases. Markov Chain Monte Carlo (MCMC) methods: MCMC methods, such as Gibbs sampling and the Metropolis-Hastings algorithm, are computational techniques used to generate samples from complex posterior distributions when analytical solutions are intractable. Bayesian linear regression: Bayesian linear regression incorporates prior beliefs about the model parameters and uses Bayesian inference to estimate the posterior distribution of the parameters, providing a principled way to handle uncertainty and regularization.
Sampling Techniques Simple random sampling: Simple random sampling is a method where each individual or element in the population has an equal chance of being selected, ensuring an unbiased representation of the population. Stratified sampling: Stratified sampling involves dividing the population into homogeneous subgroups (strata) and then selecting a random sample from each stratum, ensuring adequate representation of different subgroups. Cluster sampling: Cluster sampling divides the population into groups or clusters, and then randomly selects entire clusters for inclusion in the sample, often used when it is impractical or costly to obtain a simple random sample. Systematic sampling: Systematic sampling involves selecting elements from the population at a fixed periodic interval, such as every 10th element, ensuring a spread across the population while being more efficient than simple random sampling. Convenience sampling: Convenience sampling involves selecting elements that are readily available or convenient to the researcher, often used in exploratory studies or when random sampling is impractical, but may introduce bias.
Conclusion Importance of statistical thinking in data science: Statistical thinking and principles are foundational to data science, enabling effective data-driven decision-making, model development, and the extraction of meaningful insights from data. Emerging techniques (deep learning, transfer learning, federated learning): As data science continues to evolve, new techniques such as deep learning, transfer learning, and federated learning are gaining traction, presenting both opportunities and challenges for integrating statistical methods. Challenges (big data, high-dimensional data, streaming data): The ever-increasing volume, variety, and velocity of data pose challenges for traditional statistical methods, necessitating the development of scalable and efficient techniques for handling big data, high-dimensional data, and streaming data. Ethical considerations (data privacy, bias, and fairness): Data science applications raise ethical concerns regarding data privacy, algorithmic bias, and fairness, requiring careful consideration and the development of responsible practices and frameworks. Interdisciplinary collaborations: Effective data science often requires interdisciplinary collaborations, combining expertise from statistics, computer science, domain knowledge, and other relevant fields to tackle complex real-world problems.
Thank You ! Data Science Training in Chandigarh For Query Contact : 998874-1983