Download
1 / 51
510 likes | 839 Views
Performance Management. David Cook Director June, 2008. Performance Management from Information Builders. WebFOCUS and Performance Management Performance Management Framework Performance Metrics Manager: what is it? Integrating Arbitrary Analytic Apps with PMF PMF V5 preview and roadmap.

E N D
Performance Management David Cook Director June, 2008
Performance Management from Information Builders • WebFOCUS and Performance Management • Performance Management Framework • Performance Metrics Manager: what is it? • Integrating Arbitrary Analytic Apps with PMF • PMF V5 preview and roadmap
WebFOCUS and Performance Management Scorecards and Strategic Objectives Strategic Performance Management Methodology and Predictive Formulas Performance Management Framework Performance Metrics Manager Metrics Performance Management KPI’s KPI’s Typical WebFOCUS Application Operational Reports Operational Analytics Operational Systems
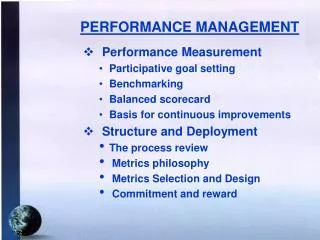
Managing Metrics Is a Common need • Metrics are an aggregated way of planning and tracking performance improvement • Managing measures: tolerances, attributes, history, and auditing is all part of metrics management • Metric definitions and formulas have been standardized and commoditized in most industries • Metric benchmark data is now a common part of competitive solutions
PMM Relationship to PMF Enterprise Scorecard framework Strategy and Methodology formulas Goals, Initiatives, Processes, Themes Strategic Dashboards and Analytic tools PMF Managed metrics with dimensions Blogging and Alert threading Metric and KPI Dashboards, Graphs, Analytic tools PMM
Performance Management Framework Business Performance Management Taking an holistic approach companies can align strategic and operational objectives across all the disciplines being attempted across the enterprise. This allows the true drivers to be identified, and used to manage the whole business. Brings together the CEO and the CFO with all other strategic offices in a company. Codifies the linkages between risk, performance and governance. Enabling management of company-wide performance through insightful decisions to help drive success Operational Processes (OPM) Project Portfolios (PPM) Financial (CPM) Federated Performance Risk Management (ERM) Compliance Governance (GRC)
PMX: PMF for Developers • This concept is applicable to the following areas: • When building a new WF analytical application • Upgrading an existing WF application • Bringing numerous WF applications together • Adding new deployment groups to an existing WF application • Add more KPI aspects to an existing application • Adding scorecards to existing metrics application
PMX PMF + custom dashboards Metrics and scorecard analytics Arbitrary Analytical application PMF core services Collaboration, Alerts, report scheduling, dashboard management, authorization, roles PMF metrics mart Application Database Source systems ETL loaders PMF loaders
PMX Overview • PMF/PMM • Are sold as stand alone PM solutions • Include vertical and horizontal templates and wizards • Expect incremental customization projects • PMX • PMF OEM package • Expect significant enhancements/customization • Inclusion and integration of Arbitrary Analytical Application (AA) creates unique solution • Comes with SDK: • Developer documentation, developer utilities
PMX Metric and scorecard services • Define AA metrics and dimensions to PMF • Schedule loads • All KPI reports/graphs/dashboards already done • Assemble dashboards with PMF and AA gadgets • Register AA reports/graphs/dashboards with PMF • Can then be accessed natively throughout PMF • Add drill-downs from PMF KPIs to AA reports • Context is passed to AA reports – documented API • Or, just add AA Tabs to PMF BID • No changes to AA app • Full PMF Scorecarding using AA metrics
PMX Core application services • Collaboration • Metric blogging can be extended to AA objects • User accessible Alerts • Alert subjects can be extended to AA objects • User accessible Report Scheduling • Any AA report can participate • User accessible Dashboard Management • AA gadgets, contextual drill-downs to AA reports • Business Roles • Extends MRE/BID into business hierarchies • Consistent authorization API for filtering
PMX product/production services • Packaging services • Install, configuration, Documentation • Cross platform/version/dbms QA and certification • PMX quality determines WF ship • Consistency of user experience • Standardization of dashboard, navigation, and business roles • Consistency of exposure of WF capabilities • WF Lab Engineered use of WF features • Best Practices WF application delivery • Documented and auditable code
PMF V5 Preview • Major new feature areas: • Google Maps, Flex Enable and Magnify built-in • New gadgets, dashboards, reports and graphs • Alternative Targets • Benchmark, stretch, forecast, etc. • Dimensional threshold tolerance settings • Support diverse deployments easily • Scorecard authorization profiles • Measure task register • More Vertical and Horizontal strategy templates • More industry-standard metric templates • Full NLV support • Built in R Stat capabilities
Google Maps As a PMF gadget, you can mash-up a Google Map to give you that location intelligence you’re looking for
Magnify Use Magnify to search for other references to the metric or dimensional value
Alternate Targets You can now include benchmark, stretch, forecast and other types of targets in your dashboards and analysis
Synchronize users with signon systems through MRE Easily import new users for PMF from your existing single-signon system, using your existing MRE and REALM driver
Scorecard Authorization Profiles Sophisticated scorecard security allows you to properly share scorecard accountabilities and save admin efforts
Measure Task Register Keep a running set of tasks around any measure. Access from the Action Gadget Detail tasks can be described and assigned with priorities, status settings and due dates
CH Robinson • Strategy – System to allow corporate mgt to drive strategy to the branches while letting each branch establish alternate weights & measures to meet unique goals • Impact – Provide a one stop shop for all performance and operational information • Why PMF – Supported CHR’s franchise model. Replace 20 OLAP Cubes, CSV files and Excel CHRW is one of the lgst. 3PL cos. in N.A., & global provider of multimodal (truck, air, ocean, & rail) trans svcs. As a non-asset-based provider, CHR focuses on solutions that work for their customers, vs. its own asset utilization
NYU Medical • Strategy – To expand the performance culture across Hospital, School of Medicine, & Research to balance performance with quality & innovation • Impact – Provide visibility to everyone as to performance in a holistic manner • Why PMF – Proven functionality, rapid implementation, flexibility & scalability One of the nation's premier centers of excellence in health care, scientific research, and medical education. With over 900 beds NYU’s campus comprises Tisch Hospital, Rusk Institute of Rehabilitation Medicine, & NYU Hospital for Joint Diseases
Gordmans • Strategy – To automate delivery of performance information to stores providing greater focus for all managers • Impact – Now everyone from Jeff Gordman down has immediate access to merchandising and distribution performance vs. weekly information • Why PMF – Proven, out of the box functionality, rapid implementation and scalable Gordmans, founded in 1915 operates 63 discount retail department stores in 15 states. Its mission is “To delight our guests with big savings on name brands in fun, easy-to shop stores.”
Hexion A legacy of innovation Our promise: To Leverage our resources and expertise to bring better products and systems to life. To improve the quality of life for people around the globe. • Strategy – To gain better management of business processes across divisions running on 1 SAP instance. • Impact – Gain better visibility into metrics of 15 processes like procure to pay to reinforce continuous improvement • Why PMF – After finding that WF was ideal for dashboards and self service reporting they also wanted a way to organize and manage metrics. Hexion Specialty Chemicals is a global leader in the manufacture of thermoset resins that are used across a broad range of industries for binding, bonding, & coating
Koch Industries • Strategy – To reinforce a performance culture by emphasizing the importance of managing by metrics • Impact – By moving off manual excel process controllers will get more timely information and more causal metrics like safety, quality, & production metrics • Why PMF – Proven WF success and they were able to see the advantages of buy vs. build & the flexibility of the PMF Datamart for difficult requirements Koch Industries & its sister company Koch Holdings, own a diverse group of companies in trading, operations & investments. In 60 countries across industries: chemicals, energy, fibers, oil, polymers, minerals, fertilizers, forest & consumer products, chemical technology equipment, ranching, securities & finances
Anglo Platinum The aim is to move the organisation to information as an asset that will contribute to the profitability and sustainability of the organisation. There must be “One version of the truth”, which everybody believes in and supports. WebFOCUS PMF was selected after a 6 month Proof-of-Concept Phase, based on architectural and business fit. • Johann Muller, CIO Anglo Platinum is the world’s sixth largest mining company & largest producer of platinum in the world. Operations comprise 7 mines, 3 joint ventures, 3 smelters, a base metals refinery and a precious metals refinery.
Due to limitations using Excel & rapidly accumulating data. LB Foster reviewed several software packages & is in the process of deploying business intelligence tools to aid in decision support. LB Foster used a disciplined approach to identify key requirements & scored leading software vendors on their ability to deliver on these requirements. • Bob Paladino, “Five Key Principles of Corporate Performance Management” Since 1902, L.B. Foster has delivered products to build and maintain our nation’s infrastructure as a manufacturer, fabricator and distributor of products for the rail, construction, utility & energy industries
“In a commodity business like generic drugs, any edge you can gain in your operations is extremely valuable, PMF provides us the edge in operational performance we need: a single version of the truth for decision making & better insight into actual sales & manufacturing processes. We can quickly generate corporate scorecards, see results linked to objectives & take action accordingly.” • David Lavallée, CIO With consistent sales growth of 25% over the last 5 years, this dynamic and innovative privately owned company will undoubtedly live up to its motto & continue to "Create the Difference" in Canada & around the world.
Lots of different dashboards reuse all of the delivered dashboard gadgets, like graphs, gauges, dials, etc
Correlation Studio Lets you select different measures or objectives and search for correlations between them
The Measure Wizard lets you pick from over 400 industry metrics, including formulas and best practices tolerances
The Measure loader lets you easily pick from available measure sources, schedule the refresh and you’re done!
Feedback lets users “blog” the measure, creating a collaborative way to support a performance culture
The Alert Wizard lets users create new alerts easily and quickly
The Measure Booklet creates a print-quality hand out with full measure display