Download
1 / 16
170 likes | 179 Views
Ukraine and the EU: A Comparison. Presentation by David Jackson LMC International Kiev, Ukraine March 2005. 5,000. 4,500. 4,000. 3,500. 3,000. '000 tonnes seed. 2,500. 2,000. 1,500. 1,000. 500. 0. 1990/91. 1994/95. 1998/99. 2002/03. 2006/07. 2010/11. Ukraine. France.

E N D
Ukraine and the EU: A Comparison Presentation by David Jackson LMC International Kiev, Ukraine March 2005
5,000 4,500 4,000 3,500 3,000 '000 tonnes seed 2,500 2,000 1,500 1,000 500 0 1990/91 1994/95 1998/99 2002/03 2006/07 2010/11 Ukraine France Spain Production
3.0 2.0 tonnes per hectare 1.0 0.0 1990/91 1993/94 1996/97 1999/00 2002/03 2005/06 2008/09 Ukraine France Spain Yield
16 14 12 10 KG per Capita Per Annum 8 6 4 2 0 1996/97 1998/99 2000/01 2002/03 2004/05 Ukraine France Spain EU Sunflower Oil Consumption
Oil Consumption All vegetable oils: • EU = 28 kilograms per capita per annum • Ukraine = 10.5 kilograms per capita per annum
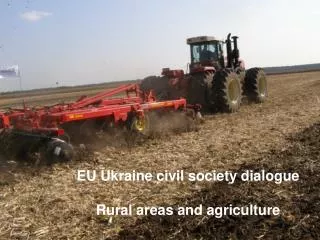
Conclusion • Comparative advantage = Field • Most underperforming sector = Field