Download
1 / 9
90 likes | 276 Views
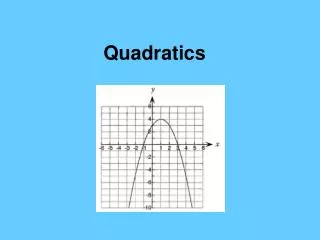
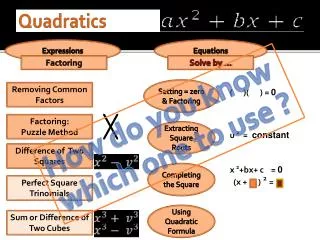
Unit 7 Quadratics Translating Graphs. Goal: I can infer how the change in parameters transforms the graph. (F-BF.3). 1. Compare graphs G1, G2 and G3. How have the graphs been affected? 2. Describe the effect of k on the equation f(x) = a(x – h) 2 + k .

E N D
Unit 7 QuadraticsTranslating Graphs Goal: I can infer how the change in parameters transforms the graph. (F-BF.3)
1. Compare graphs G1, G2 and G3. How have the graphs been affected? • 2. Describe the effect of k on the equation f(x) = a(x – h)2 + k. Changing the 0 to a 2 moved the graph up 2. Changing the 0 to a -3 moved the graph down 3. The k value shifts the graph up and down (vertically).
3. Compare graphs G1 and G4. How did changing x2 to (x+2)2 affect the graph? • 4. Compare graphs G1 and G5. How did changing x2 to (x - 3)2 affect the graph? • 5. Describe the effect of h on the equation. It shifts the graph to the left 2 spaces. It shifts the graph to the right 3 spaces. The h value shifts the graph right and left (horizontally).
6. Compare graphs G1 and G6. How did changing x2 to 2x2 affect the graph? • 7. Compare graphs G1 and G7. How did changing x2 to ½x2 affect the graph? • 8. Describe the effect of a on the equation. It makes the parabola more narrow. It makes the parabola wider. The a value widens and narrows the parabola.
9. Compare graphs G1 and G8. How did changing x2 to -x2 affect the graph? • 10. Compare graphs G1 and G9. How did changing x2 to -3x2 affect the graph? • 11. Describe the effect of a on the equation. It made the parabola open down instead of opening up. It made the parabola open down instead of opening up AND it made the parabola more narrow. The a value widens and narrows the parabola and determines the direction it will open.
Example #1 • Describe and graph the transformation of f(x) = x2 Transformations: Graph: • Left 2 spaces • Down 3 spaces
Example #2 • Describe and graph the transformation of f(x) = x2 Transformations: Graph: • Opens down • Right 1 space • Up 4 spaces
Example #3 • Describe and graph the transformation of f(x) = x2 Transformations: Graph: • Opens down • Wide • Left 2 spaces
Translating Quadratic Graphs Opens Up/Opens Down Narrow/Wide Moves left or right Moves up or down