Download
1 / 15
150 likes | 307 Views
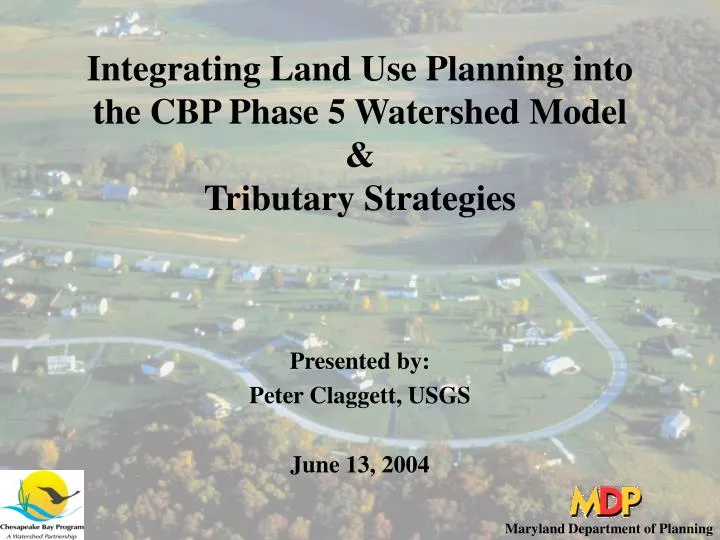
Integrating Land Use Planning into the CBP Phase 5 Watershed Model & Tributary Strategies. Presented by: Peter Claggett, USGS June 13, 2004. Maryland Department of Planning. Over the past decade in the Bay watershed: Population increased 8.2% and Impervious cover increased 40.7 %.

E N D
Integrating Land Use Planning into the CBP Phase 5 Watershed Model& Tributary Strategies Presented by: Peter Claggett, USGS June 13, 2004 Maryland Department of Planning
Over the past decade in the Bay watershed: • Population increased 8.2% and • Impervious cover increased 40.7 % “If recent trends continue, the area of developed land in the (Bay) watershed will increase by more than 60% by 2030.” ~ “Chesapeake Futures: Choices for the 21st Century”, STAC 2003.
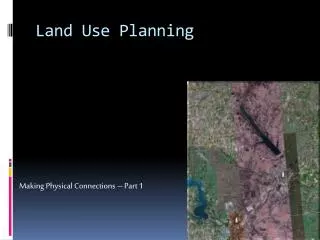
Recent Growth Areas in the Chesapeake Bay Watershed Areas of significant residential and impervious growth (1990 – 2000)
Impervious Surfaces and Runoff Wastewater Discharge (Pipe and Septic) Air Emissions and Deposition Nutrient and Sediment Loads/ Uptake Development Intensity Continuum Low Density Residential High Density Residential Commercial/ Industrial Health of the Bay
Chesapeake Bay Program’s Watershed Model Hydrologic Simulation Program- Fortran Model (HSPF)
Limitations of the growth modeling capabilities in the CBP Watershed Model (Phase 4.3) Does not consider alternative land development scenarios; Relies on 1970’s/1990’s hybrid land cover; Assumes uniform linear relationship between population growth and urban extent.
Use of finer scale and more current data Phase 4.3 94 segments 16 water quality calibration stations Phase 5.0 697 segments 70 water quality calibration stations
Use of finer scale and more current data 2000 Impervious Surface 2000 Land use/ Land cover Number of households Number of workers
A better method for forecasting growth: A decision support system that spatially allocates projections of future housing and employment and enables the exploration of alternative future development scenarios
CBP Smart Growth Decision Support System 1990 and 2000 Estimates of Residential and Commercial Development by Watershed Segment Historical Population and Housing Data (U.S. Census Bureau) Historical Employment Data (Bureau of Labor Stats.) Road & Impervious Data (GDT & Landsat) Phase 5 Watershed Modeling Segments
Smart Growth Policy Options • Density constraints • Environmental constraints • Slope • Critical habitats • Prime farmland • Water supply protection areas • Infrastructure constraints • Sewer/water service areas • Road access Estimates of County Housing Requirements Baseline scenario Baseline scenario Policy scenario A Policy scenario B Policy scenario C etc. Spatial allocation of forecasted growth to available land Estimates of Regional Office Space Requirements County Population Forecasts Phase 5 Watershed Modeling Segments Historic urban growth estimates 2000 Land Cover Data (Landsat ETM) Regional Employment Forecasts
CBP Smart Growth Decision Support System Chesapeake Bay Watershed Model (HSPF) Acceptable Scenario Water Quality Scenarios CBP Partner & Tributary Team Evaluation EPA Needs-based Sewer Model Upgrade Capital Cost Scenarios Unacceptable Scenario Smart Growth Policy Options • Density constraints • Environmental constraints • Slope • Critical habitats • Prime farmland • Water supply protection areas • Infrastructure constraints • Sewer/water service areas • Road access Baseline scenario Policy scenario A Policy scenario B Policy scenario C etc.
Benefits to the Chesapeake Bay Program Partnership • Simulation of alternative future development scenarios; • Evaluation of the water quality, infrastructure, and land conversion effects of smart growth policies; • Promotion of sound land use practices through tributary strategy implementation. • Promotion of multi-jurisdictional planning;
Potential future improvements of the CBP Smart Growth Decision Support System: • Couple with the Scenario Builder application to support the Tributary Strategies and model re-evaluation. Couple with more spatially explicit growth models (SLEUTH) and with environmental impact models for mobile air emissions (CALPUFF), and biodiversity conservation (NatureServe’s VISTA)