Download
1 / 63
630 likes | 744 Views
AP Lab Skills Guide. Data will fall into three categories:. 1. Parametric (normal) data . - Normal distribution around mean. - Mean and SD can predict future observations. Ex. Heart rate, plant height, body temp. 2 . Nonparametric data . - Does not fit normal distribution.

E N D
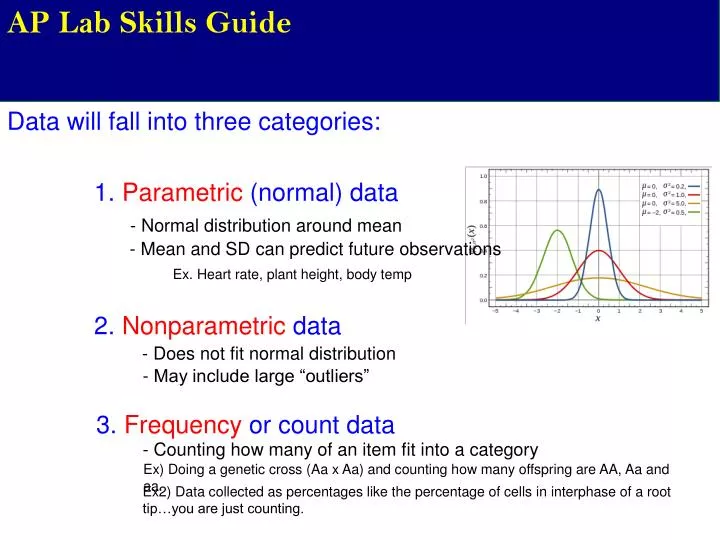
AP Lab Skills Guide Data will fall into three categories: 1. Parametric (normal) data - Normal distribution around mean - Mean and SD can predict future observations Ex. Heart rate, plant height, body temp 2. Nonparametric data - Does not fit normal distribution - May include large “outliers” 3. Frequency or count data - Counting how many of an item fit into a category Ex) Doing a genetic cross (AaxAa) and counting how many offspring are AA, Aa and aa. Ex2) Data collected as percentages like the percentage of cells in interphase of a root tip…you are just counting.
AP Lab Skills Guide Ex2) Data collected as percentages like the percentage of cells in interphase of a root tip…you are just counting.
AP Lab Skills Guide Scatterplots - Comparing two MEASURED VARIABLES - If a linear relationship is predicted, a linear regression can be performed (best fit line; Figure 3) - R2(R-squared or coefficient of determination) • Typically ranges from 0 to 1 • Describes “goodness of fit” or how well the line drawn fits the points. • R2 = 0 implies not relationship • R2 = 1 implies prefect relationship (all points on line)
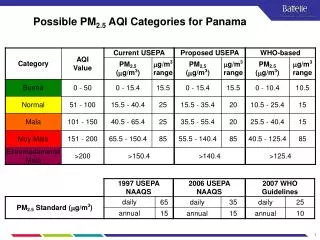
AP Lab Skills Guide Box-and-Whisker Plots (Boxplot) - Used with nonparametric data (data that is not assumed to follow a normal distribution). - Vertical lines indicate highest and lowest points in dataset - Top of box shows upper quartile and bottom shows lower quartile. 70 - Horizontal line represents the median Upper Quartile median Lower Quartile Determining Lower (Q1) and Upper (Q3) Quartiles: 32 (Q2) (Q1 - lower) (Q3 - upper) You are simply dividing the data into quarters by medians…the upper quartile is the median of the upper half of the data and vice versa…
AP Lab Skills Guide Box-and-Whisker Plots (Boxplot) Determine the upper and lower quartile of the sycamore and beech leaf data: Sycamore: 33 35 40 40 44 48 52 63 Lower Quartile(Q1) Equals 37.5 Median (Q2) Equals 42 Upper Quartile (Q3) Equals 50 Notice how the upper and lower quartile range give you a sense of the center of the data without the influence of outliers that might exist in nonparametric data!!
AP Lab Skills Guide Box-and-Whisker Plots (Boxplot) Determine the upper and lower quartile of the sycamore and beech leaf data: Beech: 11 15 19 21 26 32 34 Lower Quartile(Q1) Equals 37.5 Median (Q2) Equals 42 Upper Quartile (Q3) Equals 50 http://www.brainingcamp.com/resources/math/box-plots/questions.php
AP Lab Skills Guide Histograms Used to determine if a given set of measurements, like plant height from art. sel. lab, approximates a normal distribution (parametric) or if data is nonparametric. Histogram showing parametric data Histogram showing NONparametric data
AP Lab Skills Guide Warning
AIM: How do scientists describe population growth? Population growth rates Birth rate (B) = #born per total population size per unit time For example, if the population size is 100 and 5 individuals are born in a year then the birth rate = 5/100 or 0.05 born per individual per year Death rate (D) = #die per total population size per unit time rmax= maximum population growth rate, which only occurs when there are no population limiting factors. For example, if the population size is 100 and 10 individuals die in a year then the death rate = 10/100 or 0.1 die per individual per year Overall Rate of population growth (r) = Birth rate – Death rate Rmax is a constant for a given species. For example, rmax for bacteria is much greater than rmax for humans as they reproduce at a much greater rate. Calculate the growth rate (r) for the above example: r = .05 - .1 = -0.05 or for every 100 individuals in the population, at this moment, 5 die per year…therefore the population is…. Decreasing!! http://www.brown.edu/Courses/BI0020_Miller/week/2/eco-1-handout.pdf http://bcs.whfreeman.com/thelifewire/content/chp54/5402002.html
AIM: How do scientists describe population growth? Exponential Growth http://www.youtube.com/watch?v=c6pcRR5Uy6w
AIM: How do scientists describe population growth? Logistic Growth http://www.youtube.com/watch?v=rXlyYFXyfIM
AP Lab Skills Guide http://www.youtube.com/watch?v=UQWWSmGM0yQ
AP Lab Skills Guide http://www.youtube.com/watch?v=UQWWSmGM0yQ
AP Lab Skills Guide + Mix contents Begin Timing Tube 1 (substrate) Tube 2 (enzyme) Tube 3 (tubes 1 + 2) Begin Timing H2O2 Guaiacol Distilled H2O Peroxidase Distilled water
AP Lab Skills Guide Each minute for 5 min compare the color of tube 3 to the standard Tube 3 (tubes 1 + 2) Begin Timing Graph the data…
AP Lab Skills Guide Each minute for 5 min compare the color of tube 3 to the standard You are determining how long to let the reaction go to get a value of “5” as your baseline for comparisons in the next step…you will see…we will run all future reactions for 5 minutes and look at color and compare to enzyme in distilled water….
AP Lab Skills Guide Tube 5 Tube 6 Tube 1 Tube 2 Tube 3 Tube 4 Peroxidase H2O2 pH 12 buffer Peroxidase H2O2 pH 10 buffer Peroxidase H2O2 pH 8 buffer Peroxidase H2O2 pH 4 buffer Peroxidase H2O2 pH 6 buffer Peroxidase H2O2 pH 2 buffer Cover with parafilm, gently mix and measure color at 0 minutes and color change at time determined in part 1 (5 minutes)...
AP Lab Skills Guide Of course, we should combine the class data, take averages, SD, SE and graph with error bars…
Big Idea 3 – Investigation (Lab) 8 SUBCLONING Recall how a gene of interest is obtained (PCR), inserted into a plasmid using restriction enzymes / DNA ligase, and transformed into a bacterium for copying or expression to get protein…review chapter 20 powerpoint if you have forgotten.
Big Idea 3 – Investigation (Lab) 8 Procedure 1. In this lab you will simply take an E. coli colony, put it in a tube containing the CaCl2 solution, and either add pAMP plasmid (+) or not (-). Tube 1 (-) Tube 2 (+) pAMP plasmid E. coli (1 colony) 240ul CaCl2 solution 10 ul water E. Coli (1 colony) 240ul CaCl2 solution 10ul of Ampr plasmid (0.005 ug/ul) - Ampr gene coding for β-lactamse (enzyme that cuts up ampicillin). - ORI – origin of replication - MCS – multiple cloning sites (restriction sites)
Big Idea 3 – Investigation (Lab) 8 Procedure 2. You now of course heat shock to transform the cells. The (-) tube is obviously a negative control. The CaCl2 helps with the efficiency of the heat shock. Right after the heat shock, 250ul of liquid LB (nutrient solution) is added to tubes so that cells can begin to recover and grow. Tube 1 (-) Tube 2 (+) E. coli (1 colony) 240ul CaCl2 solution 10 ul water 250 ul liquid LB E. Coli (1 colony) 240ul CaCl2 solution 10ul of Ampr plasmid (0.005 ug/ul) 250 ul liquid LB
Big Idea 3 – Investigation (Lab) 8 Procedure 3. Plate 100ul of the 500ul cell solution on agar plates both without and amp and with ampicillin to kill untransformed cells. This is what you should see…If you grow either tube on straight LB agar then tons of colonies are observed like plates 1 and 3. If you grow the cells from each tube on LB agar +AMP then you should not see any cells for the (-) tube and only a dozen or two for the transformed (+) cells….
Big Idea 3 – Investigation (Lab) 8 Simple…just count the number of colonies you observed…this is how many cells got transformed because each colony comes from a single cell undergoing multiple rounds of binary fission. Let’s say you counted 32 colonies… 2. Now we need to know how much DNA in ug it took to get those colonies you just counted. Tube 2 (+) Remember that you added 100ul of this solution: E. Coli (1 colony) 240ul CaCl2 solution 10ul of Ampr plasmid (0.005 ug/ul) 250 ul liquid LB Figure out how much DNA you added….
Big Idea 3 – Investigation (Lab) 8 Tube 2 (+) Remember that you added 100ul of this solution: E. Coli (1 colony) 240ul CaCl2 solution 10ul of Ampr plasmid (0.005 ug/ul) 250 ul liquid LB 1. You added 10ul at 0.005ug/ul. Therefore you have .05ug of plasmid in the tube. 2. The total volume is 500ul. Therefore you have 0.05ug/500ul or 0.0001ug/ul. 3. You took 100ul of this solution: 100ul x 0.0001ug/ul = .01ug of plasmid It took .01 ug of plasmid to get those 32 colonies! = 32/0.01 or 32 colonies per 0.01 ug of plasmid = 3200 colonies per ug plasmid http://www.sciencegateway.org/tools/transform.htm
Big Idea 3 – Investigation (Lab) 9 We did a variation of this lab at the Cold Spring Harbor DNA Learning Center West… The next few slides highlight the differences between what you did and what this lab specifically asked that you do…which is to pretend that you are working a crime scene, have a DNA sample, and will cut with restriction enzymes to look for restriction fragment length polymorphisms (RFLP’S)
Big Idea 3 – Investigation (Lab) 9 Crime scene DNA Suspect DNA Restriction fragment length polymorphisms (RFLP’s = “rif lips”) The differences in restriction sites found on homologous chromosomes giving rise to different numbers and lengths of restriction fragments...review chapter 20 powerpoint for more detail. Amplified section of the DNA from the crime scene Amplified section of the same DNA segment from the suspect.
Big Idea 3 – Investigation (Lab) 9 IDEAL GEL A gel showing lambda phage DNA (same DNA you cut at the DNA learning center) cut with three different restrictions enzymes and an uncut negative control. Look at chapter 20 for a review of how gel electrophoresis works…
Big Idea 3 – Investigation (Lab) 9 Calculating the Standard Curve
Big Idea 3 – Investigation (Lab) 9 Calculating the Standard Curve 2.3 2.3 3.0 3.5 4.2 5.8 6.3
Big Idea 3 – Investigation (Lab) 9 Calculating the Standard Curve Size of fragment (bp) Relationship between DNA fragment size in bp and migration distance in a 0.8% agarose gel. 2.3 2.3 3.0 3.5 4.2 5.8 6.3 Migration distance (cm) There appears to be an exponential relationship… Or…small fragments move exponentially quicker than larger fragments… If so, then using a log scale on the y-axis should result in a linear relationship…(next slide)
Big Idea 3 – Investigation (Lab) 9 Calculating the Standard Curve 2.3 2.3 3.0 3.5 4.2 5.8 6.3 R2=0.93057
Big Idea 3 – Investigation (Lab) 9 Calculating the Standard Curve R2=0.93057 2.3 2.3 3.0 3.5 4.2 This is now our standard curve…we can use it to do what? 5.8 6.3 To calculate the sizes of the BamHI and EcoRI bands… Simply measure the distance traveled by the band and then use the curve to determine the size.
Big Idea 3 – Investigation (Lab) 9 Calculating Size of Unknown Bands 14,000 R2=0.93057 2.3 14,000 2.5 2.3 3.0 3.5 4.2 Calculate the size of the largest fragment for the BamHI digest. 5.8 6.3 The migration distance is 2.5 cm. Therefore, the size is approximately 14,000 bp (I actually used the formula for the line, which excel can give you, instead of the graph itself, but the AP will require you to use the graph).