Download

1 / 17
220 likes | 577 Views
Weltwirtschaftskrise. 1929 – ≈1939. 1909: 950 $ 1925: 250 $. Ford „Thin Lizzy“. Wohlstands-konzentration 20er Jahre. 36.000 Familien hielten 42% des Volkseinkommens 12 Millionen hielten ebenfalls 42% des Volkseinkommens

E N D
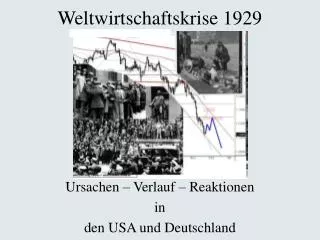
Weltwirtschaftskrise 1929 – ≈1939 Prof. Dr. Hildebrandt
1909: 950 $ 1925: 250 $ Ford „Thin Lizzy“ Prof. Dr. Hildebrandt
Wohlstands-konzentration20er Jahre 36.000 Familien hielten 42% des Volkseinkommens 12 Millionen hielten ebenfalls 42% des Volkseinkommens 12 Millionen hatten einen Jahresverdienst von 1.500 $ - bei Existenzminimum 2.500 $ Arbeitszeit 70 Stunden/Woche Amerikaner waren arm Gini Koeff. USA 1929: 0,45 Gini Koeff. USA 2009: 0,47 Gini Koeff. EU 2005: 0,31 Al Capone und Andere Prof. Dr. Hildebrandt
Der Beginn des Börsencrashs 1929 Photomaton Aktie Prof. Dr. Hildebrandt
Vernichtet mit 30 Mrd. $ das Vermögen der Armen und lässt sie mit Schulden zurück Börsencrash 23.10.1929 – 28.10.1929 Prof. Dr. Hildebrandt
30,9% Arbeitslose in Deutschland Prof. Dr. Hildebrandt
BSP in Deutschland Prof. Dr. Hildebrandt
Sozialprodukt Verwendungsseite Prof. Dr. Hildebrandt
Vermögensrückgang (Aktienmarkt) • Konsumrückgang • Investitionsausfall • Kreditimplosion • Sparpolitik des Staates (Steuererhöhungen) • Produktionsrückgang • Verdienstausfall • Konsumrückgang... Abwärtsspirale Evolutionäre Ökonomie Prof. Dr. Hildebrandt
US GNP, 1928-1940 (Quarterly totals at annual rates in billions of dollars) FDR New Deal 120 100 80 60 Goldstandard Kinderarbeit Börsenüberwachung Mindestpreise Mindestlöhne Streikrecht Freiw. Arbeitsdienst 122.000 Gebäude 1 Mio. km Straßen Förderung Landwirtschaft 1930 1935 1940 Quelle: nach Business Cycle Indicators, Vol II. G.H. Moore Ed. Weltwirtschaftskrise in den USA Prof. Dr. Hildebrandt
Goldstandard Prof. Dr. Hildebrandt
1973 Aufgabe des Bretton Woods Systems 1944 Bretton Woods Prof. Dr. Hildebrandt
US-Sparkassenkrise in den 1980er Jahren • Lateinamerikakrise in den 1970er und 1980er-Jahren • Japanische Bankenkrise in den 1990er-Jahren • Asienkrise der Jahre 1997 und 1998 • Russlandkrise der Jahre 1998 und 1999 • Brasilienkrise 1999 • Dotcom-Krise 2000 (Internet-Technik) • Finanzkrise ab 2007 (Subprime-Krise) Neuere Krisen Prof. Dr. Hildebrandt
USA - National Homeownership Strategy Leitzins 1% Verlauf der Finanzkrise 2007 I Prof. Dr. Hildebrandt
IWF schätzt weltweite Kapitalverluste auf 4 Billionen US-Dollar Verlauf der Finanzkrise 2007 II Prof. Dr. Hildebrandt
Neu -> ca. 8-Jahres Zyklus Kreislauf ökonomischer Krisen Prof. Dr. Hildebrandt
Indikatoren der Phasen Prof. Dr. Hildebrandt