Download
1 / 33
340 likes | 563 Views
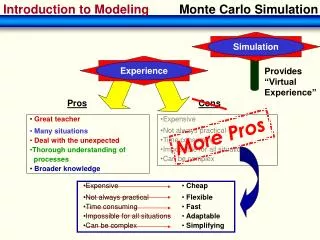
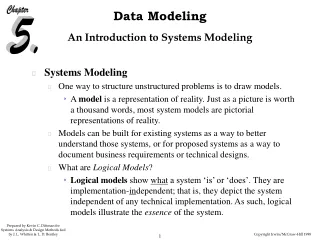
Introduction to Systems Modeling. Why Systems Modeling?. Demonstrates aggregate change over time resulting in behaviors such as: Linear Growth and Decline Quadratic Motion Exponential Growth and Decay Bounded Growth Periodic Behavior. Systems Models in Mathematics.

E N D
Why Systems Modeling? Demonstrates aggregate change over time resulting in behaviors such as: • Linear Growth and Decline • Quadratic Motion • Exponential Growth and Decay • Bounded Growth • Periodic Behavior
Systems Models in Mathematics Address Common Core Standards in Mathematics Standards for Mathematical Practices • Model with mathematics • Reason abstractly and quantitatively • Use appropriate tools strategically • Construct viable arguments and critique the reasoning of others • Make sense of problems and persevere in solving them Standards for Mathematical Content • Build a function that models a relationship between two quantities. • Construct and compare linear, quadratic, and exponential models and solve problems. • Understand that different situations may be modeled by the same structure. • Implement the modeling cycle in constructing a model.
Systems Models in Science Support teaching science as inquiry by providing: • Opportunities for careful observation and analysis of real world data and relationships. • The ability to test hypotheses, analyze results, form explanations, judge the logic and consistency of conclusions, and predict future outcomes. Support Academic Standards for Science by providing: • Examples of dynamic changes in stable systems. • Examples showing the effects of limiting factors on population dynamics.
Goals Overarching Goal: Understand how to use a systems model as a tool for learning in science and mathematics. • Identify problems that have similar model structures. • Identify the measurable variables and rates of change in a systems model. • Represent the relationships between variables in a systems model mathematically. • Validate a systems model through comparison to real-world data. • Develop an inquiry-based investigation that uses a systems model.
How are these problems similar? • Graph the speed of a car that accelerates from rest at a constant acceleration. • Graph the amount of money in my son’s savings account if his weekly allowance is constant and he spends none of his allowance. • Graph the amount of water in a bathtub if the faucet is running at a constant rate and the drain is closed.
How are these problems similar? • Graph the amount of radioactive material as it decays over time. • Graph the amount of money left in my son’s savings from his summer job if his weekly spending is a fixed percentage of the money still in his savings. • Graph the temperature of a cup of coffee as it cools to room temperature.
How are these problems similar? • Graph the number of burnt trees in a forest fire as trees are transformed from living to burning to burnt. • Graph the number of immune people as people progress from being healthy to being sick to recovering to become immune to the disease.
How are these problems similar? • Graph two populations, the predator and its prey, for a period of many years. • Graph glucose and insulin levels during a day in which three meals are eaten at regular intervals. • Graph the motion of a frictionless vertical spring.
What have we learned? Problems from different disciplines can be represented by similar model structures. (Goal 1) Graphing the expected output for a model can show the expected model structure, including the variables and the rates of change between variables. (Goal 2) Each model structure has particular mathematical relationships between its variables and their rates of change. (Goal 3)
Systems Models in Inquiry-based Investigations • Select the problem you desire to investigate. • Find a model representing this problem. • Validate the model by comparing its output to real-world data. • Experiment with the model by setting the parameters to see their effects on the output.
Coffee-Cooling • The Problem • How long will it take my cup of coffee to cool to room temperature? • The Model • http://mvhs.shodor.org/activities/physical/cooling.html • Software: http://www.vensim.com/venple.html • Validating the Model • Compare to experimental or theoretical data • Inquiry with the Model • Changing parameters
Do one of your own • The Problem • Design a problem based on one of the pre-built models at mvhs.shodor.org • The Model • Select from those on the mvhs.shodor.org website. • Validating the Model • Compare to experimental or theoretical data • Inquiry with the Model • Changing parameters
The Modeling Cycle Overarching Goal: Understand how to apply the modeling cycle to dynamic systems in science and mathematics. Image courtesy of Common Core State Standards Initiative Downloaded from www.corestandards.org
The Money Game • How much money do I need to put aside for retirement? • Once I retire, how much of my savings can I spend annually without running out? • What assumptions can I make about the growth rate of my investments? • What assumptions can I make about my life expectancy?
Formulating the Model • What is the main topic of this model? Note: This must be a measurable variable. • What actions cause this variable to change? What makes this variable increase? What makes this variable decrease? • What parameters affect those actions? • How can the relationships between the parameters, the actions and the main topic be represented mathematically?
The Answers in Vensim symbols 1. The main topic of our model is money. This is called a box variable in Vensim. 2. Interest and Deposits add to the Money. Spending subtracts from the Money. These actions are called flows or rates in Vensim.
More answers in Vensim symbols 3. Interest is based on the amount of money currently saved and the interest rate paid by the financial institution. Money is already in our model as a box variable (our main topic). The interest rate is a parameter (called a variable – auxiliary/constant). The blue arrows show that the mathematical formula for interest uses the variables Money and interest rate.
4. What is the math behind the model? Flows are quantities that are added to or subtracted from box variables. Constants or formulas may be stored in flows. The blue arrows pointing toward Interest mean that Interest equals a formula that uses interest rate and Money. The lack of blue arrows pointing toward Spending and Deposits means those rates are probably constants.
Doing the Math Let’s suppose we start with $1000 in our Money account which earns a 5% annual interest rate. Assume there are no deposits and no spending. How fast will our money grow?
What’s the Rule? The money we have at the start of Year 2 is the money we had in Year 1 + the interest earned. Have = Had + Change
Model Computation and Validation • Open the model money.mdl • Explore the model to see the underlying math. • Run the model and verify that the Money in the table agrees with the calculations done by hand. • With zero deposits and zero spending, what kind of growth does the Money graph show?
Inquiry-based Investigations • How much money do I need to put aside for retirement? • Once I retire, how much of my savings can I spend annually without running out? • What assumptions can I make about the growth rate of my investments? • What assumptions can I make about my life expectancy?
Reflections on this model • If deposits and spending are set to 0, what kind of growth does the money graph show? • What are some other real-world problems that undergo exponential growth? • How would you change this model to represent those problems?
What have we learned? Complex problems can be broken down into simple parts involving simple arithmetic. (Goals 2 & 3) Model output must be compared to real world data to validate the model. (Goal 4) Models can be used to experiment with parameters to see the differences in outcomes. (Goal 5)