Download
1 / 12
120 likes | 172 Views
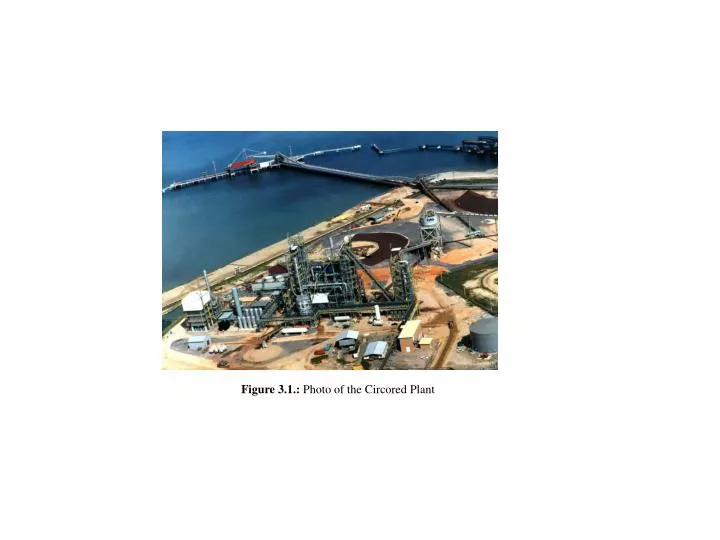
Figure 3.1.: Photo of the Circored Plant. 2nd Stage FB Reactor. 1st Stage CFB Reactor. CFB Preheater. Inclined Bucket Elevator. ~ 110 m. Briquetting Plant. Process Gas Heat Exchanger. Process Gas Compressor. Electrical Substation& Control Room. Iron Ore Fines.

E N D
2nd Stage FB Reactor 1st Stage CFB Reactor CFB Preheater Inclined Bucket Elevator ~ 110 m Briquetting Plant Process Gas Heat Exchanger Process Gas Compressor Electrical Substation& Control Room Iron Ore Fines Fired Gas Heaters HBI Product ~ 160 m Figure 3.2.: Engineering drawing
Activities • Carried out by resources • Add value and are required for completion of the flow unit • May or may not carry inventory • Have a capacity (maximum number of flow units that can flow through the activity within a unit of time) • Arrows • Indicate the flow of the flow unit • Multiple flow unit types possible (see Section 3.5) • Inventory / Buffers • Do NOT have a capacity; however, there might be a limited number of flow units that can be put in this inventory space at any moment of time • Multiple flow unit types possible Figure 3.3: Elements of a Process
Pre-Heater Pile of Iron ore fines Figure 3.4.: Process flow diagram, first step
Lock Hoppers Pre-Heater 1st Reactor 2nd Reactor Pile of Iron ore fines Figure 3.5: Process Flow diagram (to be continued)
Figure 3.6. : Completed process flow diagram for the Circored process Lock Hoppers Pre-Heater 1st Reactor 2nd Reactor Pile of Iron ore fines Flash Heater Briquetting Discharge Finished Goods
1st Reactor Dis- charge Lock Hoppers 2nd Reactor Pre-Heater Figure 3.7. : Completed process flow diagram for the Circored process Briquet- ting Flash heater Pile of Iron ore fines Finished goods
Supply constrained Supply constrained Demand constrained Demand constrained Bottleneck Bottleneck Bottleneck Bottleneck (Capacity) (Capacity) (Capacity) (Capacity) Input Input Input Input Flow Rate Flow Rate Flow Rate Flow Rate Demand Demand Excess Excess Excess Excess capacity capacity capacity capacity Demand Demand Figure 3.8.: Supply constrained (left) and demand constrained (right) process
Utilization 100% Mismatch between demand and Mismatch between demand and supply at the process level supply at the process level 90% 80% Imbalance relative Imbalance relative 70% To bottleneck To bottleneck 60% 50% 40% 30% 20% 10% 0% Preheater Preheater Lock Lock CFB CFB Stationary Stationary Flash Flash Pressure Pressure Briquetting Briquetting Total Total Hoppers Hoppers Reactor Reactor heater heater let let - - down down machine machine process process system system Bottleneck Bottleneck Figure 3.9.: Utilization Profile
15% Outflow 15% Outflow 15% Outflow 10% Outflow 10% Outflow 10% Outflow 7.5% Outflow 7.5% Outflow 7.5% Outflow Lock Lock st st nd nd Pre Pre - - Heater Heater 1 1 Reactor Reactor 2 2 Reactor Reactor Hoppers Hoppers Pile of Iron ore fines Pile of Iron ore fines Flash Flash Briquetting Briquetting Discharge Discharge Heater Heater Finished Goods Finished Goods Figure 3.10: Refined process flow diagram accounting for mass reduction
Contact faculty/ Contact faculty/ other persons other persons Consulting Consulting Staff Staff Verified Applications Verified Applications File File Internship Internship Contact prior Contact prior employers employers Confirmation Confirmation letter letter Benchmark Benchmark grades grades Figure 3.10: Process flow diagram with multiple product types
Compute the Compute the Compute the Use demand to Use demand to Use demand to Prepare a Prepare a Prepare a Compute various Compute various Compute various Capacity for Capacity for Capacity for compute the compute the compute the Identify the Identify the Identify the Process Flow Process Flow Process Flow Performance Performance Performance each of the each of the each of the implied utilization implied utilization implied utilization Bottleneck Bottleneck Bottleneck Diagram Diagram Diagram measures measures measures Resources Resources Resources levels levels levels Use different Use different Note that capacity Note that capacity Compute the work Compute the work - - Step with highest Step with highest Extensions required Extensions required Colors to mark Colors to mark levels may differ levels may differ load across all load across all implied utilization implied utilization for working with for working with Flow units Flow units depending on depending on product types product types multiple flow units multiple flow units product type product type Figure 3.11: Summary of process analysis