Download
1 / 24
250 likes | 400 Views
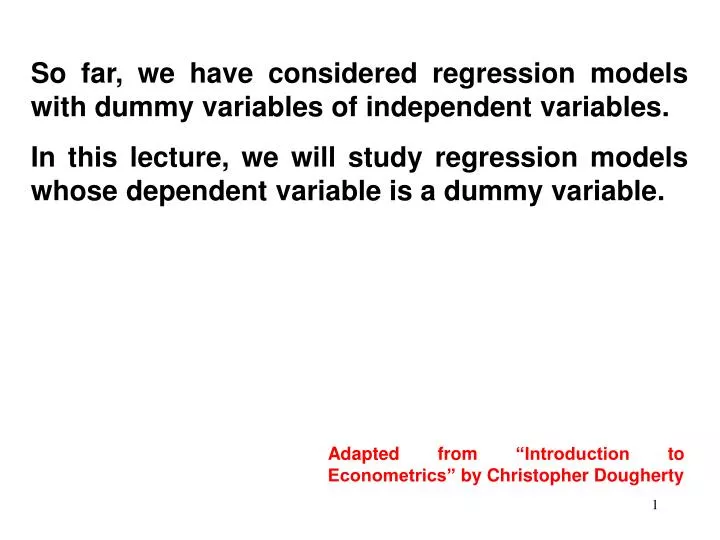
So far, we have considered regression models with dummy variables of independent variables. In this lecture, we will study regression models whose dependent variable is a dummy variable. Adapted from “Introduction to Econometrics” by Christopher Dougherty.

E N D
So far, we have considered regression models with dummy variables of independent variables. In this lecture, we will study regression models whose dependent variable is a dummy variable. Adapted from “Introduction to Econometrics” by Christopher Dougherty
BINARY CHOICE MODELS: LINEAR PROBABILITY MODEL • Why do some people go to college while others do not? • Why do some women enter the labor force while others do not? • Why do some people buy houses while others rent? • Why do some people migrate while others stay put? • Why do some people commit crime while others do not? • Why some loans were approved by the bank while others got rejected? • Why do some people vote while others do not? • Why do some people marry while others do not? The models that have been developed for this purpose are known as binary choice models, with the outcome, which we will denote Y, being assigned a value of 1 if the event occurs and 0 otherwise.
The simplest binary choice model is the linear probability model where, as the name implies, the probability of the event occurring, p, is assumed to be a linear function of a set of explanatory variables. Of course p is unobservable. One has data on only the outcome, Y. In LPM, we regress the dummy variable on a set of Xs using OLS, i.e.,
The LPM predicts the probability of an event occurring, i.e. Yi = 1. In other words, the RHS of the equation must be interpreted as a probability, i.e., restricted to between 0 and 1. For example, if the predicted value is 0.70, this means the event has a 70% chance of occurring. The coefficient kof the LPM can be interpreted as the marginal effect of Xk on the probability that Yi = 1, holding other factors constant.
y, p 1 Points on the fitted line represent the predicted probabilities of the event occurring (i.e., Y =1 ) for each value of X b1 0 Xi X
Example Suppose that we are modeling the decision of women to enter the labor force, with A simple LPM of labor force entry as a function of education yields
Predictions for Labor Force Model • For a person with no education • For a person with a high school education • For a person with a Masters and Ph.D. (23 years)
ILLUSTRATION 1 • Why do some people graduate from high school while others drop out? We will define a variable GRAD which is equal to 1 if the individual graduated from high school (i.e., those who had more than 11 years of schooling), and 0 otherwise. We consider only one explanatory variable, i.e., the ASVABC score. Our regression model is in the form: GRAD = 1 + 2ASVABC + i
. g GRAD = 0 . replace GRAD = 1 if S > 11 (509 real changes made) . reg GRAD ASVABC Source | SS df MS Number of obs = 540 -------------+------------------------------ F( 1, 538) = 49.59 Model | 2.46607893 1 2.46607893 Prob > F = 0.0000 Residual | 26.7542914 538 .049729166 R-squared = 0.0844 -------------+------------------------------ Adj R-squared = 0.0827 Total | 29.2203704 539 .05421219 Root MSE = .223 ------------------------------------------------------------------------------ GRAD | Coef. Std. Err. t P>|t| [95% Conf. Interval] -------------+---------------------------------------------------------------- ASVABC | .0070697 .0010039 7.04 0.000 .0050976 .0090419 _cons | .5794711 .0524502 11.05 0.000 .4764387 .6825035 ------------------------------------------------------------------------------ Here is the result of regressing GRAD on ASVABC. It suggests that every additional point on the ASVABC score increases the probability of graduating by 0.007, that is, 0.7%.
. g GRAD = 0 . replace GRAD = 1 if S > 11 (509 real changes made) . reg GRAD ASVABC Source | SS df MS Number of obs = 540 -------------+------------------------------ F( 1, 538) = 49.59 Model | 2.46607893 1 2.46607893 Prob > F = 0.0000 Residual | 26.7542914 538 .049729166 R-squared = 0.0844 -------------+------------------------------ Adj R-squared = 0.0827 Total | 29.2203704 539 .05421219 Root MSE = .223 ------------------------------------------------------------------------------ GRAD | Coef. Std. Err. t P>|t| [95% Conf. Interval] -------------+---------------------------------------------------------------- ASVABC | .0070697 .0010039 7.04 0.000 .0050976 .0090419 _cons | .5794711 .0524502 11.05 0.000 .4764387 .6825035 ------------------------------------------------------------------------------ The intercept has no sensible meaning. Literally it suggests that a respondent with a 0 ASVABC score has a 58% probability of graduating. However a score of 0 is not possible.
ILLUSTRATION 2 • Why do some people buy houses while others rent? We will define a variable HOME which is equal to 1 if the family owned a house, and 0 otherwise. We consider only one explanatory variable INCOME ($’000) Our regression model is in the form: HOME = 1 + 2INCOME + i
Dependent Variable: HOME Method: Least Squares Sample: 1 40 Included observations: 40 ------------------------------------------------------------------------------ Variable | Coefficient Std. Error t-Statistic Prob. -------------+---------------------------------------------------------------- C | -0.945686 0.122841 -7.698428 0.0000 INCOME | 0.102131 0.008160 12.51534 0.0000 ------------------------------------------------------------------------------ R-squared 0.804761 Mean dependent var 0.525000 Adjusted R-squared 0.799624 S.D. dependent var 0.505736 S.E. of regression 0.226385 Akaike info criterion 0.084453 Sum squared resid 1.947505 Schwarz criterion -9.25E-06 Log likelihood 3.689064 F-statistic 156.6336 Durbin-Watson stat 1.955187 Prob(F-statistic) 0.000000 Here is the result of regressing HOME on INCOME. It suggests that every additional unit on income ($1000) increases the probability of owning a house by 0.1021, that is, 10.21%. If INCOME = 12, HOME = -0.945686 + 0.102131*12 = 0.279886, indicating that if the income of a family is $12,000, the estimated probability of owing a house is 28%.
Dependent Variable: HOME Method: Least Squares Sample: 1 40 Included observations: 40 ------------------------------------------------------------------------------ Variable | Coefficient Std. Error t-Statistic Prob. -------------+---------------------------------------------------------------- C | -0.945686 0.122841 -7.698428 0.0000 INCCOME | 0.102131 0.008160 12.51534 0.0000 ------------------------------------------------------------------------------ R-squared 0.804761 Mean dependent var 0.525000 Adjusted R-squared 0.799624 S.D. dependent var 0.505736 S.E. of regression 0.226385 Akaike info criterion 0.084453 Sum squared resid 1.947505 Schwarz criterion -9.25E-06 Log likelihood 3.689064 F-statistic 156.6336 Durbin-Watson stat 1.955187 Prob(F-statistic) 0.000000 The intercept has a value of -0.9457. Probability cannot be negative! So, it is treated as zero. Literally it suggests that a respondent with a 0 INCOME has zero probability of owning a house. No income, no house.
ILLUSTRATION 3 • Why do some women enter the labor force while others do not? We will define a variable PARTICIPATE which is equal to 1 if the woman has a job or is looking for a job, and 0 otherwise (not in the labor force). We consider two explanatory variables: MARRIED = 1 if the woman is married = 0 otherwise EDUCATION = number of years of schooling Our regression model is in the form: PARTICIPATE = 1 + 2MARRIED + 3EDUCATION +i
Dependent Variable: PARTICIPATE Method: Least Squares Sample: 1 30 Included observations: 30 ------------------------------------------------------------------------------ Variable | Coefficient Std. Error t-Statistic Prob. -------------+---------------------------------------------------------------- C | -0.284301 0.435743 -0.652452 0.5196 MARRIED | -0.381780 0.153053 -2.494430 0.0190 EDUCATION | 0.093012 0.034598 2.688402 0.0121 ------------------------------------------------------------------------------ R-squared 0.363455 Mean dependent var 0.600000 Adjusted R-squared 0.316304 S.D. dependent var 0.498273 S.E. of regression 0.412001 Akaike info criterion 1.159060 Sum squared resid 4.583121 Schwarz criterion 1.299180 Log likelihood -14.38590 F-statistic 7.708257 Durbin-Watson stat 2.550725 Prob(F-statistic) 0.002247 The output suggests that the probability of a woman participating in the labor force falls 38.18% if she is married, holding constant her schooling. On the other, the probability increases by 9.3% for every additional year of schooling, holding constant her marital status.
SHORTCOMINGS OF LPM As noted earlier, the LPM is estimated using the OLS. However, there are several shortcomings with the LPM. (1) The error term is not normally distributed As usual, the value of the dependent variable Yiin observation i has a (i) deterministic component and (ii) a random component. The deterministic component depends on Xi and the parameters, i.e., E(Yi). The random component is the error term (i).
E(Yi) is simple to compute, because it can take only two values. It is 1 with probability pi and 0 with probability (1 –pi). The expected value in observation i is: This means that we can rewrite the model as shown:
Y, p 1 b1 +b2Xi b1 0 Xi X The probability function is thus the deterministic component of the relationship between Y and X.
The two possible values, which give rise to the observations A and B, are illustrated in the diagram (see next slide!). Since Y takes on only two values (zero and one), the error term u also take on only two values. Hence, the error term does not have a normal distribution. Note: Normality is not required for the OLS estimates to be unbiased but it is necessary for efficiency.
Y, p A 1 1 –b1–b2Xi b1 +b2Xi b1 b1 + b2Xi B 0 Xi X
(2) The distribution of the error term is heteroskedastic The population variance of the error term in observation i is given by: Since the variance of the error term is a function of the value of X, we have no-constant variance. In other words, the distribution of the error term is heteroscedastic. The consequence is that the OLS estimator is inefficient and the standard errors are biased, resulting in incorrect hypothesis tests. Note: Weighted least square (WLS) has been suggested to deal with the problem of heteroskedasticity.
(3) The LPM is not compatible with the assumed probability structure Another shortcoming of the LPM is that the predicted probabilities can be greater than 1 or less than 0. Consider the simple LPM with only one independent variable: The fitted line is: As noted earlier, yhat can be interpreted as the predicted probability of an event occurring (or Y = 1, or the probability of success). Probabilities can only range between 0 and 1. However, in OLS, there is no constraint that the yhat estimates fall in the 0-1 range; indeed, yhat is free to vary between - and +.
Y, p 1 b1 +b2Xi b1 0 Xi X
In the range where X is very large or very small, the predicted probability can be outside the 0-1 range. Some people try to solve this problem by setting probabilities that are greater than (less than) one (zero) to be equal to one (zero). Note: The more appropriate solution is offered by logit or probit models, which keep the OLS predicted values within the 0-1 range.