Download
1 / 37
370 likes | 451 Views
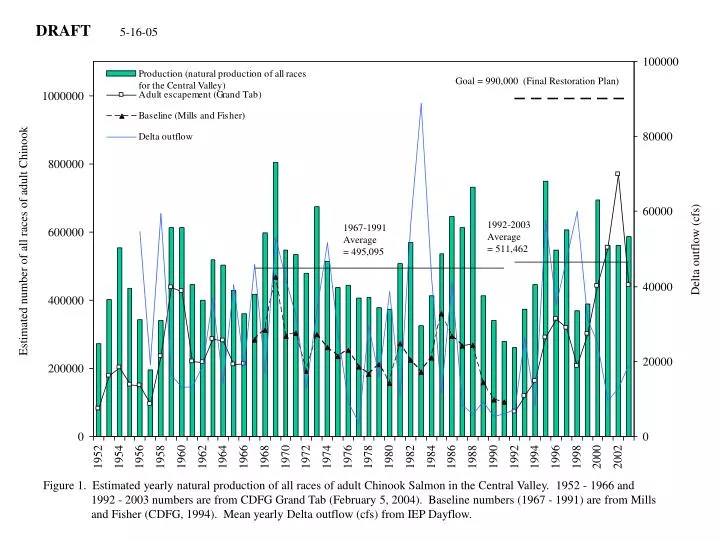
DRAFT. 5-16-05. Goal = 990,000 (Final Restoration Plan). 1992-2003 Average = 511,462. 1967-1991 Average = 495,095. Estimated number of all races of adult Chinook. Delta outflow (cfs).

E N D
DRAFT 5-16-05 Goal = 990,000 (Final Restoration Plan) 1992-2003 Average = 511,462 1967-1991 Average = 495,095 Estimated number of all races of adult Chinook Delta outflow (cfs) Figure 1. Estimated yearly natural production of all races of adult Chinook Salmon in the Central Valley. 1952 - 1966 and 1992 - 2003 numbers are from CDFG Grand Tab (February 5, 2004). Baseline numbers (1967 - 1991) are from Mills and Fisher (CDFG, 1994). Mean yearly Delta outflow (cfs) from IEP Dayflow.
DRAFT 5-16-05 Goal = 750,000 (Final Restoration Plan) 1992-2003 Average = 472,880 Delta outflow (cfs) Estimated number of adult of fall-run Chinook 1967-1991 Average =374,638 Figure 2. Estimated yearly natural production of adult fall-run Chinook salmon in the Central Valley, and in river escapements. 1952 - 1966 and 1992 - 2003 numbers are from CDFG Grand Tab (February 5, 2004). Baseline numbers (1967 - 1991) are from Mills and Fisher (CDFG, 1994). Mean yearly Delta outflow (cfs) from IEP Dayflow.
DRAFT 5-16-05 Delta outflow (cfs) Goal = 110,000 (Final Restoration Plan) Estimated number of adult winter-run Chinook 1967-1991 Average = 55,060 1992-2003 Average = 6,284 Data not available Figure 3. Estimated yearly adult natural production, and in river adult escapements of winter-run Chinook salmon in the Central Valley. 1992 - 2003 numbers are from CDFG Grand Tab (February 5, 2004). Baseline numbers (1967-1991) are from Mills and Fisher (CDFG, 1994). Mean yearly Delta outflow (cfs) from IEP Dayflow.
DRAFT 5-16-05 Goal = 68,000 (Final Restoration Plan) Estimated number of adult late-fall Chinook Delta outflow (cfs) 1967-1991 Average = 34,764 1992-2003 Average = 19,223 Data not available Figure 4. Estimated yearly adult natural production, and in river adult escapements of late-fall-run Chinook salmon in the Central Valley. 1967 – 2003 numbers are from CDFG Grand Tab (February 5, 2004). Baseline numbers (1967 - 1991)are from Mills and Fisher (CDFG, 1994). Mean yearly Delta outflow (cfs) from IEP Dayflow.
DRAFT 5-16-05 Goal = 68,000 (Final Restoration Plan) Delta outflow (cfs) Estimated number of adult spring-run Chinook 1967-1991 Average = 34,706 1992-2003 Average =15,762 Data not available Figure 5. Estimated yearly adult natural production, and in river adult escapements of spring-run Chinook salmon in the Central Valley. 1960 - 1966 and 1992 - 2003 numbers are from CDFG Grand Tab (February 5, 2004). Baseline numbers (1967 - 1991) are from Mills and Fisher (CDFG, 1994). Mean yearly Delta outflow (cfs) from IEP Dayflow.
DRAFT 5-16-05 Goal = 230,000 (Final Restoration Plan) 1967-1991 Average = 116,502 Estimated number of adult fall-run Chinook, 1992-2003 Average = 73,973 Flow (cfs) Hatchery escapement only, 1952 - 1955 Figure 6. Estimated yearly adult natural production, and in river adult escapements of Sacramento River fall-run Chinook salmon. 1952 - 1966 and 1992 - 2003 numbers are from CDFG Grand Tab (February 5, 2004). Baseline numbers (1967 - 1991) are from Mills and Fisher (CDFG, 1994). Flow information (mean yearly cfs) is from USGS site 11377100 above Bend Bridge. Mean yearly flow (cfs) information from USGS 11377100, Sacramento River above Bend Bridge.
DRAFT 5-16-05 Goal = 69,022 (Doubling the 1967 - 2001 mean calculated in CHINOOKPROD) Goal = 44,000 (Final Restoration Plan) 1967-1991 Average = 34,511 Flow (cfs) Estimated number of adult late-fall-run Chinook 1992-2003 Average = 18,686 Data not available 1996 = 107 1997 = 0 Figure 7. Estimated yearly adult natural production, and in river adult escapements of Sacramento River late-fall-run Chinook salmon. 1992 -2003 numbers are from CDFG Grand Tab (February 5, 2004). Baseline numbers (1967 - 1991) are from Mills and Fisher (CDFG, 1994). Note that the doubling goal in the Final Restoration Plan is not double the 1967 - 2001arithmetic mean as calculated in CHINOOKPROD. Mean yearly flow (cfs) information from USGS 11377100, Sacramento River above Bend Bridge.
DRAFT 5-16-05 Goal = 59,000 (Final Restoration Plan) Flow (cfs) Estimated number of adult spring-run Chinook 1967-1991 Average = 29,649 Data not available 1992-2003 Average = 583 Figure 8. Estimated yearly adult natural production, and in river adult escapements of Sacramento River spring-run Chinook salmon. 1992-2003 numbers are from CDFG Grand Tab (February 5, 2004). Baseline numbers (1967 - 1991) are from Mills and Fisher (CDFG, 1994). Mean yearly flow (cfs) information from USGS 11377100, Sacramento River above Bend Bridge.
DRAFT 5-16-05 Goal = 110,000 (Final Restoration Plan) Flow (cfs) Estimated number of adult winter-run Chinook 1967-1991 Average = 54,935 Data not available 1992-2003 Average = 6,284 Figure 9. Estimated yearly adult natural production, and in river adult escapements of Sacramento River winter-run Chinook salmon. 1992 - 2003 numbers are from CDFG Grand Tab (February 5, 2004). Baseline numbers (1967 - 1991) are from Mills and Fisher (CDFG, 1994). Mean yearly flow (cfs) information from USGS 11377100, Sacramento River above Bend Bridge.
DRAFT 5-16-05 Flow (cfs) Estimated number of adult fall-run Chinook 1992-2003 Average = 6,962 Goal = 7,100 (Final Restoration Plan) 1967-1991 Average = 3,835 Figure 10. Estimated yearly adult natural production, and in river adult escapements of Clear Creek fall-run Chinook salmon. = data was not available for 1961, 1970-1975, 1979 and 1980. 1992 - 2003 numbers are from CDFG Grand Tab (February 5, 2004). Baseline numbers (1967 - 1991) are from Mills and Fisher (CDFG, 1994). Mean yearly flow (cfs) information from USGS 11372000 Clear Creek near Igo.
DRAFT 5-16-05 Flow (cfs) Estimated number of adult fall-run Chinook Goal = 5,900 (Final Restoration Plan) 1992-2003 Average = 3,999 1967-1991 Average = 2,995 Figure 11. Estimated yearly adult natural production, and in river adult escapements of Cottonwood Creek fall-run Chinook salmon. = data was not available for 1952, 1970 - 1975, 1979 - 1980 and 1993 - 2003. 1952 - 1966 and 1992 - 2003 numbers are from CDFG Grand Tab (February 5, 2004). Baseline numbers (1967 - 1991) are from Mills and Fisher (CDFG, 1994). Mean yearly flow (cfs) information from USGS 11376000 Cottonwood Creek near Cottonwood.
DRAFT 5-16-05 Flow (cfs) Estimated number of adult fall-run Chinook Goal = 4,600 (Final Restoration Plan) 1967-1991 Average = 2,370 1992-2003 Average – data not available Figure 12. Estimated yearly natural production, and in river escapements of Cow Creek adult fall-run Chinook salmon. = data was not available for 1952, 1961, 1963, 1970 - 1975, 1977 - 1983, and 1992 - 2003. 1952 - 1966 numbers are from CDFG Grand Tab (February 5, 2004). Baseline numbers (1967 - 1991) are from Mills and Fisher (CDFG, 1994). Flow information from USGS 11376550 Battle Creek below Coleman National Fish Hatchery. Mean yearly flow (cfs) information from USGS 11374000 Cow Creek near Millville.
DRAFT 5-16-05 Coleman National Fish Hatchery on the creek. Hatchery proportion = 0.9 The high adult escapement numbers compared to production estimates indicates a hatchery contribution to the in-river numbers. Estimated number of adult fall-run Chinook Flow (cfs) 1992-2001 Average = 23,278 Goal = 10,000 (Final Restoration Plan) 1967-1991 Average = 5,072 Figure 13. Estimated yearly natural production, and in river escapements of Battle Creek adult fall-run Chinook salmon. 1952 - 1966 and 1992 - 2003 numbers are from CDFG Grand Tab (February 5, 2004). Baseline numbers (1967 - 1991) are from Mills and Fisher (CDFG, 1994). Mean yearly flow (cfs) information from USGS 11376550 Battle Creek below Coleman National Fish Hatchery.
DRAFT 5-16-05 Coleman National Fish Hatchery on the creek. Hatchery proportion = 0.9 The high adult escapement numbers compared to production estimates indicates a hatchery contribution to the in-river numbers. Estimated number of adult late-fall-run Chinook Flow (cfs) 1992-2003 Average = 644 Goal = 550 (Final Restoration Plan) 1967-1991 Average = 275 Figure 14. Estimated yearly natural production calculated from hatchery returns (in river returns were not available), and hatchery returns of Battle Creek adult late-fall-run Chinook salmon. 1992 - 2003 numbers are from CDFG Grand Tab (February 5, 2004). = data was not available for 1952-1968, 1978-1980, 1984 and 2001-2003. Baseline numbers (1967 - 1991) are from Mills and Fisher (CDFG, 1994). Mean yearly flow (cfs) information from USGS 11376550 Battle Creek below Coleman National Fish Hatchery.
DRAFT 5-16-05 Goal = 330 (Final Restoration Plan) Estimated number of adult fall-run Chinook Flow (cfs) 1965-1991 Average = 167 1992-2003 Average - data not available Figure 15. Estimated yearly natural production, and in river escapements of Paynes Creek adult fall-run Chinook salmon. = data was not available for 1952 - 1964, 1967 - 1968, 1970 - 1981, and 1905 - 2003. 1965-1966 numbers are from CDFG Grand Tab (February 5, 2004). Baseline numbers (1967 - 1991) are from Mills and Fisher (CDFG, 1994). Mean yearly flow (cfs) information from USGS 11377500, Paynes Creek near Red Bluff.
DRAFT 5-16-05 Estimated number of adult fall-run Chinook Flow (cfs) Goal = 720 (Final Restoration Plan) 1967-1991 Average = 364 1992-2003 Average - data not available Figure 16. Estimated yearly natural production, and in river escapements of Antelope Creek adult fall-run Chinook salmon. = data was not available for 1952, 1959, 1961, 1978 - 1980, 1987,1990, 1991, and 1993 - 2003. 1952 - 1967 and 1992 - 2003 numbers are from CDFG Grand Tab (February 5, 2004). Baseline numbers (1967 - 1991) are from Mills and Fisher (CDFG, 1994). Mean yearly flow (cfs) information from USGS 11379000 Antelope Creek near Red Bluff.
DRAFT 5-16-05 Estimated number of adult fall-run Chinook Flow (cfs) 1992-2003 Average = 1,051 Goal = 1,500 (Final Restoration Plan) 1967-1991 Average = 769 Figure 17. Estimated yearly natural production, and in river escapements of Deer Creek adult fall-run Chinook salmon. = data was not available for 1955, 1961, 1990 - 1992, 1995, 1996, and 1999 - 2003. 1952 - 1966 and 1992 - 2003 numbers are from CDFG Grand Tab (February 5, 2004). Baseline numbers (1967 - 1991) are from Mills and Fisher (CDFG, 1994). Mean yearly flow (cfs) information from USGS 11383500 Deer Creek near Vina.
DRAFT 5-16-05 Estimated number of adult spring-run Chinook Flow (cfs) Goal = 6,500 (Final Restoration Plan) 1992-2003 Average = 2,997 1967-1991 Average = 3,298 Figure 18. Estimated yearly natural production, and in river escapements of Deer Creek adult spring-run Chinook salmon. = data was not available for 1952 - 1962, 1965 - 1969, 1977, 1979, 1984, and 1988. 1952 - 1966, and 1992 - 2003 numbers are from CDFG Grand Tab (February 5, 2004). Baseline numbers (1967 - 1991) are from Mills and Fisher (CDFG, 1994). Mean yearly flow (cfs) information from USGS 11383500 Deer Creek near Vina.
DRAFT 5-16-05 Estimated number of adult fall-run Chinook Flow (cfs) 1992-2003 Average = 2,716 Goal = 4,200 (Final Restoration Plan) 1967-1991 Average = 2,137 Figure 19. Estimated yearly natural production, and in river escapements of Mill Creek adult fall-run Chinook salmon. = data was not available for 1990, 1995 - 1996, and 1999 - 2001. 1952 -1966 and 1992 – 2003 numbers are from CDFG Grand Tab (February 5, 2004). Baseline numbers (1967 – 1991) are from Mills and Fisher (CDFG, 1994). Mean yearly flow (cfs) information from USGS 11381500, Mill Creek near Los Molinos.
DRAFT 5-16-05 Estimated number of adult fall-run Chinook Flow (cfs) Goal = 4,400 (Final Restoration Plan) 1967-1991 Average = 2,220 1992-2003 Average = 1,282 Figure 20. Estimated yearly natural production, and in river escapements of Mill Creek adult spring-run Chinook salmon. = data was not available for 1952 - 1959, 1965 - 1969, 1976, 1979, and 1983. 1952 - 1966 and 1992 - 2003 numbers are from CDFG Grand Tab (February 5, 2004). Baseline numbers (1967 - 1991) are from Mills and Fisher (CDFG, 1994). Mean yearly flow (cfs) information from USGS 11381500, Mill Creek near Los Molinos.
DRAFT 5-16-05 Miscellaneous creeks above RBDD include Spring Gulch, China Gulch, Olney, Ash, Stillwater, and Inks creeks (Mills and Fisher). Bear Creek numbers are included in the Mills and Fisher numbers, but not sited as one of the miscellaneous creeks. Estimated number of adult fall-run Chinook Goal = 1,100 (Final Restoration Plan) 1967-1991 Average = 553 1992-2003 Average - data not available Figure 21. Estimated yearly natural production of miscellaneous creeks adult fall-run Chinook salmon above RBDD. = data was not available for 1952, 1961 - 1963, 1971 - 1975, and 1977 - 2003. 1952 - 2003 numbers are from CDFG Grand Tab (February 5, 2004). Baseline numbers (1967 - 1991) are from Mills and Fisher (CDFG, 1994).
DRAFT 5-16-05 Miscellaneous creeks between RBDD and Princeton Ferry include Salt, Craig, Dye, Toomes, Thomes, Coyote, Stoney, and Singer Creek. These creeks are not included in Mills and Fisher, but listed in Grand Tab. Estimated number of adult fall-run Chinook Goal = not set (Final Restoration Plan) 1967 - 1991 Average = 498 1992-2003 Average - Data not available Figure 22. Estimated yearly natural production of miscellaneous creeks adult fall-run Chinook salmon below RBDD. = data was not available for 1960-1968, 1970, 1978, 1979, and 1985 - 2003. 1952 - 1966 and 1992 - 2003 numbers are from CDFG Grand Tab (February 5, 2004). Baseline numbers (1967 - 1991) are from Mills and Fisher (CDFG, 1994).
DRAFT 5-16-05 Estimated number of adult fall-run Chinook Flow (cfs) 1992-2003 Average = 2,140 Goal = 1,500 (Final Restoration Plan) 1967-1991 Average = 779 Figure 23. Estimated yearly natural production, and in river escapements of Butte Creek adult fall-run Chinook salmon. = data was not available for 1952 - 1964, 1966 - 1970, 1973, 1977, 1979 - 1982, 1984, 1986,1987, 1990 -1994, and 2001. 1952 - 1966 and 1992 - 2003 numbers are from CDFG Grand Tab (February 5, 2004). Baseline numbers (1967 – 1991) are from Mills and Fisher (CDFG, 1994). Mean yearly flow (cfs) information from USGS 11390000 Butte Creek near Chico.
DRAFT 5-16-05 The Butte Creek is one of the tributaries where restoration work has been conducted since 1996. Estimated number of adult spring-run Chinook Flow (cfs) 1992-2003 Average = 11,266 Goal = 2,000 (Final Restoration Plan) 1967-1991 Average = 1,032 Figure 24. Estimated yearly natural production, and in river escapements of Butte Creek adult spring-run Chinook salmon. 1952- 1966 and 1992 - 2003 numbers are from CDFG Grand Tab (February 5, 2004). = data was not available for 1952 - 1959, and 1991. Baseline numbers (1967 - 1991) are from Mills and Fisher (CDFG, 1994). Mean yearly flow (cfs) information from USGS 11390000 Butte Creek near Chico.
DRAFT 5-16-05 Goal = 800 (Final Restoration Plan) Estimated number of adult fall-run Chinook Flow (cfs) 1967-1991 Average = 242 1992-2003 Average - data not available Figure 25. Estimated yearly natural production, and in river escapements of Big Chico Creek adult fall-run Chinook salmon. = data was not available for 1952 - 1956, 1958 - 1982, and 1986 - 2003. 1952 - 1967 and 1992 - 2003 numbers are from CDFG Grand Tab (February 5, 2004). Baseline numbers (1967 - 1991) are from Mills and Fisher (CDFG, 1994). Mean yearly flow (cfs) information from USGS 11384000 Big Chico Creek near Chico.
DRAFT 5-16-05 Goal = has not been set. Mills and Fisher did not list this run; data was from Grand Tab only. Estimated number of adult spring-run Chinook Flow (cfs) 1992-2003 Average = 161 1967-1991 Average = 144 Figure 26. Estimated yearly natural production, and in river escapements of Big Chico Creek adult spring-run Chinook salmon. = data was not available for 1952 - 1961, 1970, 1972,1975 - 1976, 1978 - 1983, 1986 - 1992, and 2002. 1952 - 2003 numbers are from CDFG Grand Tab (February 5, 2004). Mean yearly flow (cfs) information from USGS 11384000 Big Chico Creek near Chico.
DRAFT 5-16-05 Feather River State Fish Hatchery on the river. Hatchery proportion = 0.4 Goal = 170,000 (Final Restoration Plan) 1992-2003 Average = 131,161 Estimated number of adult fall-run Chinook Flow (cfs) Hatchery escapement only 1967-1991 Average = 84,318 Figure 27. Estimated yearly natural production, and in river escapements of Feather River adult fall-run Chinook salmon. In-river escapements were not available for 1990 and 1998. 1952 - 1966 and 1992 - 2003 numbers are from CDFG Grand Tab (February 5, 2004). Baseline numbers (1967 - 1991) are from Mills and Fisher (CDFG, 1994). Mean yearly flow (cfs) information from USGS 11407000, Feather River at Oroville.
DRAFT 5-16-05 Goal = 66,000 (Final Restoration Plan) Estimated number of adult fall-run Chinook 1992-2003 Average = 44,087 Flow (cfs) 1967-1991 Average = 33,541 Figure 28. Estimated yearly natural production, and in river escapements of Yuba River adult fall-run Chinook salmon. 1967-1991 baseline numbers are from Mills and Fisher (CDFG, 1994). 1952 - 1966 and 1992-2003 numbers are from CDFG Grand Tab (February 5, 2004). = data was not available for 1952. Mean yearly flow (cfs) information from USGS 11421000, Yuba River at Marysville.
DRAFT 5-16-05 1967-1991 Average = 637 Goal = 450 (Final Restoration Plan) Estimated number of adult fall-run Chinook Flow (cfs) • 1992-2003 • Average • data not • available Figure 29. Estimated yearly natural production, and in river escapements of Bear River adult fall-run Chinook salmon. = data was not available for 1952 - 1983, and 1985 - 2003. Numbers are from CDFG Grand Tab (February 5, 2004). Mean yearly flow (cfs) information from USGS 11424000 Bear River near Wheatland.
DRAFT 5-16-05 Nimbus State Fish Hatchery on the river. Hatchery proportion = 0.4 Goal = 160,000 (Final Restoration Plan) Estimated number of adult fall-run Chinook 1967-1991 Average =81,476 Flow (cfs) 1992-2003 Average = 147,151 Figure 30. Estimated yearly natural production, and in river escapements of American River adult fall-run Chinook salmon. 1952 - 1966, and 1992 - 2003 numbers are from CDFG Grand Tab (February 5, 2004). Baseline numbers (1967 - 1991) are from Mills and Fisher (CDFG, 1994). Mean yearly flow (cfs) information from USGS 11446500, American River near Fair Oaks.
DRAFT 5-16-05 Mokelumne River State Fish Hatchery on the river. Hatchery proportion = 0.4 Hatchery escapement only Goal = 9,300 (Final Restoration Plan) Estimated number of adult fall-run Chinook Flow (cfs) 1992-2003 Average = 8,836 1967-1991 Average = 4,700 Figure 31. Estimated yearly natural production, and in river escapements of Mokelumne River adult fall-run Chinook salmon. In river escapement numbers were not available for 2001. 1952 – 1966 and 1992 - 2003 numbers are from CDFG Grand Tab (February 5, 2004). Baseline numbers (1967 - 1991) are from Mills and Fisher (CDFG, 1994). Mean yearly flow (cfs) information from USGS 11325500 Mokelumne River at Woodbridge.
DRAFT 5-16-05 Estimated number of adult fall-run Chinook Flow (cfs) 1967-1991 Average = 1,697 Goal = 3,300 (Final Restoration Plan) 1992-2003 Average= 652 Figure 32. Estimated yearly natural production, and in river escapements of Cosumnes River adult fall-run Chinook salmon. = data was not available for 1952, 1959, 1961, 1976-1977, 1982, 1986, 1987, 1989 - 1997, and 1999 - 2003. 1952-2003 numbers are from CDFG Grand Tab (February 5, 2004). Baseline numbers (1967 - 1991) are from Mills and Fisher (CDFG, 1994). Mean yearly flow (cfs) information from USGS 11335000, Cosumnes River at Michigan Bar.
DRAFT 5-16-05 Goal = 2,200 (Final Restoration Plan) Estimated number of adult winter-run Chinook Flow (cfs) 1967 -1991 Average = 780 1992-2003 Average - data not available Figure 33. Estimated yearly natural production of Calaveras River adult winter-run Chinook salmon. = data was not available for 1952 - 1974, 1977, 1979 – 1983, and 1985 - 2003. 1952 - 2003 numbers are from CDFG Grand Tab (February 5, 2004). Baseline numbers from Mills and Fisher (CDFG, 1994) were not available. Mean yearly flow (cfs) information from USGS 11308900 Calaveras River below New Hogan Dam.
DRAFT 5-16-05 Estimated number of adult fall-run Chinook Flow (cfs) 1967-1991 Average = 10,977 Goal = 22,000 (Final Restoration Plan) 1992-2003 Average = 7,750 Figure 34. Estimated yearly natural production, and in river escapements of Stanislaus River adult fall-run Chinook salmon. 1952 – 1966, and 1992 - 2003 numbers are from CDFG Grand Tab (February 5, 2004). Baseline numbers (1967 - 1991) are from Mills and Fisher (CDFG, 1994). = data was not available for 1982. Mean yearly flow (cfs) information from USGS 11303000, Stanislaus River at Ripon.
DRAFT 5-16-05 Estimated number of adult fall-run Chinook Flow (cfs) Goal = 38,000 (Final Restoration Plan) 1967-1991 Average = 19,044 1992-2003 Average = 10,977 Figure 35. Estimated yearly natural production, and in river escapements of Tuolumne River adult fall-run Chinook salmon. 1952-1966, and 1992-2003 numbers are from CDFG Grand Tab (February 5, 2004). Baseline numbers (1967 - 1991) are from Mills and Fisher (CDFG, 1994). Mean yearly flow (cfs) information from USGS 11290000, Tuolumne River at Modesto.
DRAFT 5-16-05 Merced River State Fish Hatchery on the river. Hatchery proportion = 0.1 Estimated number of adult fall-run Chinook Flow (cfs) Goal = 18,000 (Final Restoration Plan) 1992-2003 Average = 9,684 1967-1991 Average = 9,052 Figure 36. Estimated yearly natural production, and in river escapements of Merced River adult fall-run Chinook salmon. 1952 - 1966, and 1992 - 2003 numbers are from CDFG Grand Tab (February 5, 2004). = data was not available for 1952 - 1953, and 1955 - 1956. Baseline numbers (1967 - 1991) are from Mills and Fisher (CDFG, 1994). Mean yearly flow (cfs) information from USGS 11270900, Merced River below Mercer Falls Dam.
DRAFT 5-16-05 Goal = has not been set Flow (cfs) Estimated number of adult fall-run Chinook 1992 -2003 Average = 28,410 1967 - 1991 Average = 38,635 Figure 37. Estimated yearly natural production, and in river escapements of San Joaquin System adult fall-run Chinook salmon. The San Joaquin System is the sum of the Stanislaus, Tuolumne, and Merced Rivers. 1952 - 1966, and 1992 - 2003 numbers are from CDFG Grand Tab (February 5, 2004). Baseline numbers (1967 - 1991) are from Mills and Fisher (CDFG, 1994). Mean yearly flow (cfs) information from USGS 11303500, San Joaquin River near Vernalis.