Download
1 / 51
510 likes | 597 Views
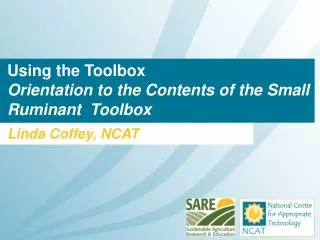
Using the Scientific Toolbox for Policy Analysis:. Getting started. Author, presenter. Organization. PwC. www.ecoregionalfund.com. Author, presenter. Organization. PwC. www.ecoregionalfund.com. Tibet – World’s roof top. ISSUES The water tower role Poverty of water stewards

E N D
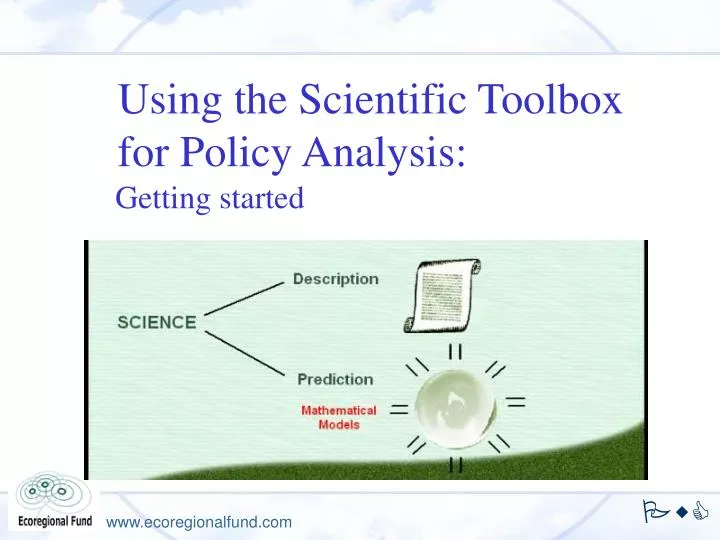
Using the Scientific Toolbox for Policy Analysis: Getting started Author, presenter. Organization PwC www.ecoregionalfund.com
Author, presenter. Organization PwC www.ecoregionalfund.com
Tibet – World’s roof top • ISSUES • The water tower role • Poverty of water stewards • Low external input agriculture • Low accessibility to markets • Growing demand for food • Data scarce environment PwC www.ecoregionalfund.com
Author, presenter. Organization PwC www.ecoregionalfund.com
Author, presenter. Organization PwC www.ecoregionalfund.com
Author, presenter. Organization PwC www.ecoregionalfund.com
Author, presenter. Organization PwC www.ecoregionalfund.com
Author, presenter. Organization PwC www.ecoregionalfund.com
Water resources and Tibet • Tibet is the “water tower" of Asia and rivers originating in Tibet (e.g. Mekong, Yellow river, Yangthze, Yarlung Tsampo, Indus) support hundreds of millions of people downstream • Perennial flows of these rivers largely rely on the constant flux of the Tibetan glaciers • Annual hydrological transfer to downstream countries total 577 km3 from a basin of 1.1 million km2 • Mountain regions are considered the “blackest box of black boxes” in the global hydrological cycle (increased specific yield, seasonal delay of discharge, decreased seasonal variability) Author, presenter. Organization PwC www.ecoregionalfund.com
Water resources and Tibet Values: • Water supply • Pivotal role in sustaining soil fertility • Hydropower (1300 TWh) • Plateau lakes are of ecological and religious importance Author, presenter. Organization PwC www.ecoregionalfund.com
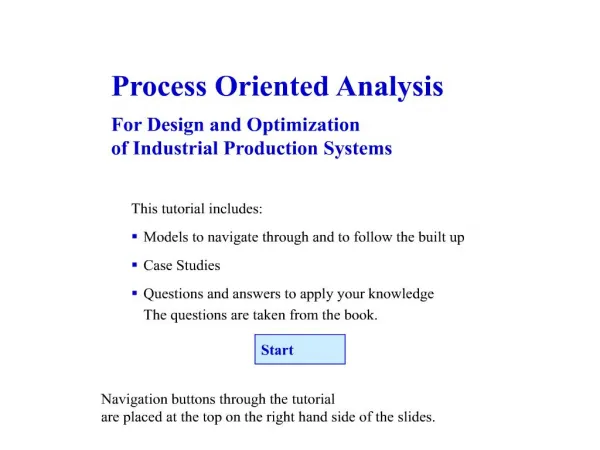
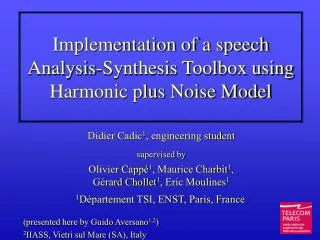
Hydrologic Balance Evaporation and Transpiration Precipitation Surface Runoff Root Zone Infiltration/plant uptake/ Soil moisture redistribution Vadose (unsaturated) Zone Lateral Flow Percolation to shallow aquifer Revap from shallow aquifer Shallow (unconfined) Aquifer Return Flow Confining Layer Flow out of watershed Deep (confined) Aquifer Recharge to deep aquifer
Author, presenter. Organization PwC www.ecoregionalfund.com
PwC www.ecoregionalfund.com
Author, presenter. Organization PwC www.ecoregionalfund.com
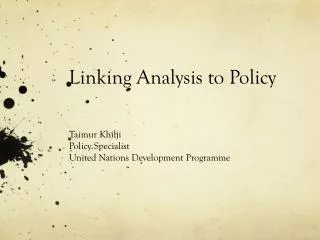
Modelling of water resources PwC www.ecoregionalfund.com
Modelling of water resources Author, presenter. Organization PwC www.ecoregionalfund.com
Author, presenter. Organization PwC www.ecoregionalfund.com
Modelling of water resources Author, presenter. Organization PwC www.ecoregionalfund.com
Modelling of water resources Author, presenter. Organization PwC www.ecoregionalfund.com
Modelling of water resources Author, presenter. Organization PwC www.ecoregionalfund.com
Modelling of water resources • Water is key in bridging the gap between potential and actual production • Watershed shows limited response to changes in land use and water management – shallow soils, steep slopes, low water holding capacity • SWAT is a suitable tool to address the effects of management, climate and land use change scenarios on the water resources at various scales Author, presenter. Organization PwC www.ecoregionalfund.com
Author, presenter. Organization PwC www.ecoregionalfund.com
Author, presenter. Organization PwC www.ecoregionalfund.com
Author, presenter. Organization PwC www.ecoregionalfund.com
PwC www.ecoregionalfund.com
ISSUES • Free trade agreements and implications • Competitiveness • Research/extension re-alignment • Good market accessibility • High external input agriculture • Sustainability of Natural Resources • Water towers • “Data-rich” environment Author, presenter. Organization PwC www.ecoregionalfund.com
PwC www.ecoregionalfund.com
Author, presenter. Organization PwC www.ecoregionalfund.com
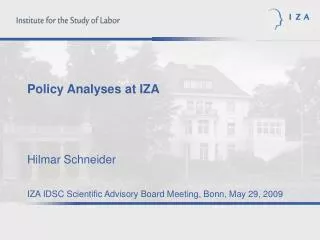
y = -107.95x + 828.35 700 2 R = 0.9022 600 500 400 Weight Gain (kg/year) 300 2 y = -65.937x + 457.38x - 205.5 2 R = 0.8865 200 100 0 0 1 2 3 4 5 Heads per hectare Author, presenter. Organization kg por hectarea kg por animal With the technology generated by IDIAP farmers Could reduce production costs from $1.30 to 0.83 PwC www.ecoregionalfund.com
Gross Margin 250,000 200,000 150,000 100,000 50,000 (US$) - Grazing + Maize Grass-Legume Pasture (50,000) Base Scenario Reaching biological Potential (100,000) (150,000) (200,000) - a precio actual de 0.34 US$ - a precio del TLC 0.15 US$ Dairy farms in the highlands adopting pasture Technology could compete for local market Author, presenter. Organization PwC www.ecoregionalfund.com
Banana plantations affected by Sigatoka Author, presenter. Organization PwC www.ecoregionalfund.com
Author, presenter. Organization PwC www.ecoregionalfund.com
Land use conflict map Author, presenter. Organization PwC www.ecoregionalfund.com
Simulated potato yield with local variety To compete for the local market farmers should hace a cost of < $ 0.16 per kg, meaning having yields above 35 t/ha or decreasing production costs Author, presenter. Organization PwC www.ecoregionalfund.com
Author, presenter. Organization PwC www.ecoregionalfund.com
Disminucion de la Erosión debido al Cambio de Zonas Cultivo de Papa por Pasto Ejm Microcuenca#7 Microcuencas
Chiriqui Viejo Upper Watershed: Gross Margin (Actual) in Conflict areasDue to Milk Production and Potato Production 100% ($) Author, presenter. Organization PwC www.ecoregionalfund.com
Chiriqui Viejo Upper Watershed: Gross Margin for conflict areas transformed into pasture (50 % and 100 % ) for Dairy Author, presenter. Organization PwC www.ecoregionalfund.com
Author, presenter. Organization PwC www.ecoregionalfund.com
Disminución de la Concentración de Carbofuradan en el Río Chiriqui Viejo debido a la Adopcion de MIP y el Cambio de Zonas de Cultivo de Papa por Pasto Ejm Microcuenca 7 Todas las Microcuencas
Incentive curve for Carbofuran reduction in the upper watershed of the Chiriqui Viejo River 100 90 80 70 60 Incentive $/Kg 50 40 30 20 10 0 0 20000 40000 60000 80000 100000 120000 Carbofuran Reduction, Kg of Active Ingredient Papa MIP Papa MIP/Pastos
Expected Adoption Curve providing incentive for reducinf carbofuran in the water