Download
1 / 56
770 likes | 1.1k Views
GNSS REFLECTOMETRY FOR SEA SURFACE WIND SPEED ESTIMATION. D. Schiavulli , F. Nunziata, M. Migliaccio, G. Pugliano Università degli Studi di Napoli “ Parthenope ”. VII Riunione annuale CeTeM – AIT sul Telerilevamento a microonde: Sviluppi scientifici ed implicazioni tecnologiche. OUTLINE.

E N D
GNSS REFLECTOMETRY FOR SEA SURFACE WIND SPEED ESTIMATION D. Schiavulli, F. Nunziata, M. Migliaccio, G. Pugliano Università degli Studi di Napoli “Parthenope” VII Riunione annuale CeTeM – AIT sul Telerilevamento a microonde: Sviluppi scientifici ed implicazioni tecnologiche
OUTLINE • Motivation • Modeling • Simulation • Experiments • Conclusions
OUTLINE • Motivation • Modeling • Simulation • Experiments • Conclusions
GNSS Constellations GNSS are allweatherL-band satellite sytemsdedicatedtonavigationpurposes:
GNSS Constellations GNSS are allweatherL-band satellite sytemsdedicatedtonavigationpurposes: • GPS: 24 satellites • Glonass: 24 satellites • Beidou: 35 satellites (completed 2020) • Galileo: 27 satellites (operative 2020)
GNSS Constellations The GNSS are designedto providePositioning, Velocity and Time (PVT) toanuser with a receiver
GNSS Constellations The GNSS are designedto providePositioning, Velocity and Time (PVT) toanuser with a receiver. The distancesatellite-usermeasuring the TimeofArrival (ToA) of the directsignal, i.e. LineofSight (LoS). 4 satellites are neededtocompute x,y,z and time
GNSS Signal • Pseudo-Random-Noise (PRN) codes: • zero mean: • constantenvelope 1 • PRN is a sequenceofrandomrectangluarpulsescalledchips: • Autocorrelation = 1 • Cross-correlation = 0 t+τc t-τc t
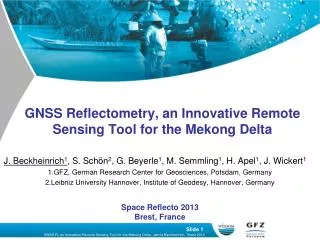
GNSS-REFLECTOMETRY GNSS Reflectometry (GNSS-R) isan innovative techniquethatexploits GNSS signalsreflected off surfacesassignalsofopportunitytoinfergeophysical information of the reflecting scene.
GNSS-R vs Remote SensingMissions • Excellenttemporalsampling and global coverage; • Long-term GNSS mission life; • Costeffectiveness, i.e. only a receiverisneeded.
GNSS-R vs Remote SensingMissions • Excellenttemporalsampling and global coverage; • Long-term GNSS mission life; • Costeffectiveness, i.e. only a receiverisneeded. GNSS satellitescoverageSnapshot
GNSS-R Applications Soilmoisture Ice observation Seasurfaceobservation Altimetry
SeaSurfaceObservation Off shore wind farm Coastal erosion Maritimecontrol in harborareas Weather forecasting
OUTLINE • Motivation • Modeling • Simulation • Experiments • Conclusions
GNSS-R forSeaSurfaceObservationModel Specular reflectiondominatesthisscattering scenario, GeometricOptic (GO) approximationhasbeenused. Forsmoothsurface, e.g. calmsee Tx Rx Specular Point
GNSS-R forSeaSurfaceObservationModel When the searoughnessincreases, the transmittedsignalisspreadedover the seasurface and differentpointswithin the so calledGlistening Zone (GZ) contributeto the scatteredpower Tx Rx glistening zone Rx Tx glistening zone
GNSS-R GeometryModeling • Nominal Specular Point (SP) is in the originofaxes; • Transmitter and receiverlie in the zyplane; • Pointswhosescatteredwaveexperiences the samedelaylie in anellippsewithTx and Rxasits foci (iso-rangeellipse) • Pointswhosescatteredwaveexperiences the samefrequncyshiftlie in anhyperbola (iso-Doppler hyperbola) • The receivedpowerismapped in Delay Doppler Map (DDM)
OUTLINE • Motivation • Modeling • Simulation • Experiments • Conclusions
GNSS-R ModelSimulation Simulated data are differentfromreal data but are very Important:
GNSS-R ModelSimulation Simulated data are different from real data but are very Important: • To better understand the scattering scenario • To simulate a complex scenario in a controlled environment
GNSS-R Simulation The receivedaveragescatteredpowerisgivenby:
GNSS-R Simulation The receivedaveragescatteredpowerisgivenby: Where • Ti is the coherentintegrationtime • D is the radiation antenna pattern • Rtand Rrare the distancesbetweenTx-scatterer and Rx-scatterer, respectively • Λ(•)S(•) represents the Woodward AmbiguityFunction (WAF) • is the Fresnelcoefficient accounting polarizationfrom RHCP to LHCP • σo is the Normalized Radar Cross Section (NRCS) – Gaussianslopes PDF
Woodward AmbiguityFunction The WAF represents the cross-correlationperformed at the receiver between the scatteredsignal and the generated replica, where
Woodward AmbiguityFunction The WAF represents the cross-correlationperformed at the receiver between the scatteredsignal and the generated replica, where • Along the thedelayaxes, the overlappingofrectangularchipsgenerated a trianglurashapefunction:
Woodward AmbiguityFunction The WAF represents the cross-correlationperformed at the receiver between the scatteredsignal and the generated replica, where • Along the thedelayaxes, the overlappingofrectangularchipsgenerated a trianglurashapefunction: • Along the Doppler axes a sincfunctionisgenerated: • For lowspeedreceiver, i.e. airborne or fixedplatform, the Doppler effect can beneglected and S(δf) = 1 and 1-D DelayMapisgenerated.
OUTLINE • Motivation • Modeling • Simulation • Experiments • Conclusions
Experiments In thisstudy the potentialitiesof GPS L1 C/A signalforseasurfacewindspeedestimationhavebeeninvestigated and the system sensitivityhasbeenevaluatedagainst:
Experiments In thisstudy the potentialitiesof GPS L1 C/A signalforseasurfacewindspeedestimationhavebeeninvestigated and the system sensitivityhasbeenevaluatedagainst: • receiveraltitude ; • Transmitterelevation angle; • Wind speed.
Experiments GNSS-R SIMULATOR Wind speed Receiveraltitude Elevation angle Receivedwaveform
Experiments GNSS-R SIMULATOR Wind speed Receiveraltitude Elevation angle Receivedwaveform
Experiments GNSS-R SIMULATOR Wind speed Receiveraltitude Elevation angle Receivedwaveform
Experiments GNSS-R SIMULATOR Wind speed Receiveraltitude Elevation angle Receivedwaveform
Experiments Signal-to-Noise-Ratiohasbeenevaluatedas: Where: Receivedpower – bistatic link budget Thermalnoise
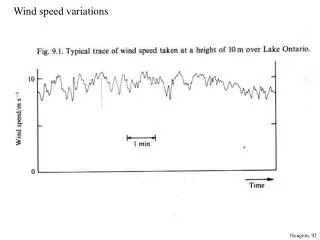
Experiments The receivedtriangular-shapewaveformiswinddependent
Experiments H = 10 Km elevation angle = 45°
Experiments H = 10 Km elevation angle = 30°
Experiments H = 10 Km elevation angle = 60°
Experiments H = 1 Km elevation angle = 45°
Experiments H = 1 Km elevation angle = 30°
Experiments H = 1 Km elevation angle = 60°