Download
1 / 42
420 likes | 562 Views
The State of the Church in Georgia 1990-2000. Dave Olson www.TheAmericanChurch.org.

E N D
The State of the Churchin Georgia1990-2000 Dave Olson www.TheAmericanChurch.org © 2004 by David T. Olson Sample - Not for Public Use
This is a Sample PresentationIt’s purpose is to give you an idea of what is happening to the Christian church in Georgia, and what the complete “State of the Church in Georgia” Powerpoint looks like. The goal is to encourage pastors and church lay leaders to view and discuss together the missional challenges in Georgia that the Church faces. The complete Powerpoint is $14.95 and is available for immediate download athttp://www.theamericanchurch.org/state/UGA20.htm © 2004 by David T. Olson Sample - Not for Public Use
In 1996, polls taken immediately after the Presidential election revealed that 58% of people claimed they had voted, when in reality only 49% actually did. This is called the Halo Effect. People tend to over-inflate their participation in activities that create acceptability within their social group. For many decades, pollsters such as Gallup and Barna have reported that around 45% of Americans attend church every Sunday. But there is a religious Halo Effect. Actual attendance counts have shown that the percentage of people attending church on any given weekend is much lower than was previously thought. © 2004 by David T. Olson Sample - Not for Public Use
The Intent of this presentation is to answer and then expand on two key questions: “How Many People Really Attend Church in Georgia Every Week?” “Is the Christian Church Going Forward or Backwards in Influence in Georgia?” As the data is analyzed county by county assessing a number of factors, a comprehensive picture of the State of the Church in Georgia will begin to take shape. © 2004 by David T. Olson Sample - Not for Public Use
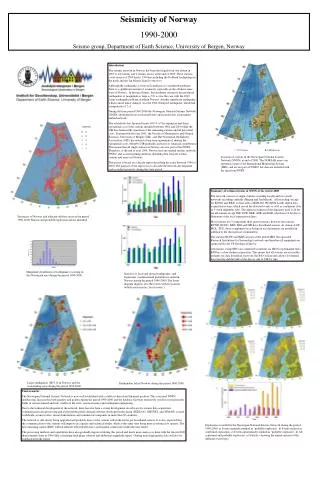
This study uses weekend church attendance as a more reliable and more immediate snapshot of Christian influence than membership. The following map shows the percentage of the population attending a Christian church on any given weekend in all 50 states in 2000. Georgia has an attendance percentage (23.3%) that is higher than the average for the nation (18.7%). © 2004 by David T. Olson Sample - Not for Public Use
The Next Map shows the percentage of the population attending a Christian church on any given weekend in 2000 for each county in Georgia. The church attendance rate in northern Georgia is lower than in southern Georgia. © 2004 by David T. Olson Sample - Not for Public Use
The Next 2 Maps show the population numbers for each county in Georgia. The first map shows the population size of each county. Fourteen counties have a population of over 100,000 people. The second map shows the growth or decline in population for each county from 1990 - 2000. The blue counties declined in population. The counties around Atlanta saw incredible growth. © 2004 by David T. Olson Sample - Not for Public Use
Complete Presentation hasMap of 2000 Population Growth for Each County
The Next 2 Maps show the ethnicity of Georgia in 1990 and 2000. The third slide shows the grow of decline in the percentage of the population for each ethnic group. © 2004 by David T. Olson Sample - Not for Public Use
The Next Graph shows the attendance numbers for the churches in Georgia in 1990 and 2000. Most noteworthy is the slight growth of Evangelical churches and the slight decline of Catholic and Mainline churches. Unfortunately, as overall worship attendance has remained quite stable, the population has grown. A more reliable standard for evaluating increasing or declining influence is the percentage of the population attending church on any given weekend, shown in the second graph. © 2004 by David T. Olson Sample - Not for Public Use
Complete Presentation hasGraph of 1990 & 2000 Worship Percentage by Category
The Next Graph is a Pie graph visualizing the percentage of the population at churches in each category in 2000. The “Absent” category indicates the percentage of the population that is not worshipping at a Christian church on any given weekend. The second graph shows the percentage gain or decline for each category in Georgia in 1990 and 2000. Most noteworthy is the decline of each group. © 2004 by David T. Olson Sample - Not for Public Use
The 3 Next Charts show the relative strength of the 8 major denominational groups in Georgia. The Pie Chart shows how much Baptists predominate in Georgia. The second and third charts show that all groups have declined with the exception of the Pentecostals and the Catholics. © 2004 by David T. Olson Sample - Not for Public Use
Complete Presentation hasPie Chart of 2000 Attendance by Denominational Families
Complete Presentation hasBar Graph of 1990 & 2000 Attendance by Denominational Families
The Next 3 Maps show the attendance percentages for the Evangelical, Catholic and Mainline churches in each county in Georgia in 2000. © 2004 by David T. Olson Sample - Not for Public Use
Complete Presentation hasState Map of 2000 Evangelical Attendance Percentage for each County
Complete Presentation hasState Map of 2000 Mainline Attendance Percentage for each County
The Next Map shows the growth or decline in the percentage of the population attending a Christian church on any given weekend from 1990 to 2000 for each county. 52 counties grew in attendance percentage, while 107 counties declined. © 2004 by David T. Olson Sample - Not for Public Use
Complete Presentation hasState Map of 1990 - 2000 Christian Church Attendance Percentage Increase or Declinefor each County
The Next 3 Maps show the growth or decline of attendance percentages for the Evangelical, Catholic and Mainline churches in each county in Georgia between 1990 and 2000. For evangelicals, 55 counties grew in attendance percentage, while 105 counties declined. For mainline churches, 30 counties grew in attendance percentage, while 129 counties declined. For Catholics, 71 counties grew in attendance percentage, while 33 counties declined. © 2004 by David T. Olson Sample - Not for Public Use
Complete Presentation hasState Map of 1990 - 2000 Evangelical Attendance Percentage Increase or Declinefor each County
Complete Presentation hasState Map of 1990 - 2000 Mainline Attendance Percentage Increase or Declinefor each County
The Final Chart shows the net gain in the number of churches in Georgia in the past decade. There was a net gain of 1249 churches. However, to keep up with the population growth in Georgia, there would have needed to have been an additional 1784 more churches started from 1990 - 2000. © 2004 by David T. Olson Sample - Not for Public Use
The State of the Church in Georgia . . . • Georgia offers both great opportunities and great challenges for the Church. • The southern half of the state has a higher attendance percentage than the northern half. • While Christian church attendance has grown quite dramatically, the percentage of the population attending church has been declining slightly in the Evangelical and Mainline church, while slightly growing for the Catholic church. • A major factor in the overall decline is the insufficient net gain in the number of churches in the growing areas of Georgia. If the present decade is to rectify that state-wide, 1784 more churches would need to be started in the state than in the previous decade. © 2004 by David T. Olson Sample - Not for Public Use
For More Information . . . • Please go to www.theamericanchurch.org for additional information on the American Church. • 12 Surprising Facts about the American Church is available athttp://www.theamericanchurch.org/12supm.htm • The complete Georgia Powerpoint presentation is available athttp://www.theamericanchurch.org/state/UGA20.htm • The Complete Atlanta Powerpoint presentation is available at http://www.theamericanchurch.org/metro/Atlanta.htm • A Combo Pack (12 Surprising Facts, Georgia and Atlanta Powerpoints) is available at http://www.theamericanchurch.org/combo/GA0.htm © 2004 by David T. Olson Sample - Not for Public Use
Information on the Information • The spiritual health of churches is multifaceted, and is obviously much more complex than an attendance trend can portray. However, following the example of St. Luke in the Book of Acts, who used the number of people who showed up at various events as a sign documenting the health and growth of the early church, I would suggest that attendance is the single most helpful indicator of health, growth and decline. • Information has been compiled only for orthodox Christian groups – Protestant, Catholic and Orthodox. The Mormons, Jehovah Witnesses, Unitarian-Universalists and the International Churches of Christ have not been included. In addition, information about non-Christian groups has not been compiled. • African American denominations publish very little that is statistical – often not even a list of current churches. This study used data from the 1990 Glenmary study on Black Baptist estimates and AME Zion churches, the average African American worship attendance (from the Barna Research Group), and a statistical model based on the population of African Americans in each county in 1990 and 2000. These were combined to come up with as accurate an estimate as possible. • Independent church data is almost impossible to obtain. (There are actually many fewer totally independent churches than is assumed. Most are part of some voluntary association, which typically keeps some records.) Data from the 1990 & 2000 Glenmary study on larger Independent churches (limited to over 300 in attendance) was used along with a statistical model to estimate the attendance at smaller independent churches. • In Catholic churches, the definition of what constitutes membership varies with diocese and church, making numbers sometimes inconsistent from state to state and county to county. In addition to actual mass counts from 1/3rd of Catholic parishes, membership information has been merged with attendance patterns from similar dioceses based on the size of the diocese and the region in which it is located. • Orthodox Churches are included in Totals, but not included as a separate group because of smallness of size nationwide. Division into Evangelical and Mainline categories is based on the division by the Glenmary Study. • This study only looks at how many people attend a Christian church on any given Sunday. The term ‘regular attender’ can be designated to mean someone who attends a Christian church on a consistent basis. Using a simple definition for ‘regular attender’ (attends at least 3 out of every 8 Sundays), between 25% and 27% of Americans would fit this category. Adding ‘regular attenders’ of non-orthodox christian churches and other religions to the totals would increase the percentage to 28% – 30%. © 2004 by David T. Olson Sample - Not for Public Use
This Presentation is based on a nationwide study of American church attendance, as reported by churches and denominations. The database currently has average worship attendances for each of the last 10 years for over 170,000 individual churches. It also uses supplementary information (actual membership numbers correlated with accurate membership to attendance ratios) to project the attendances of all other denominational and independent churches. All told, accurate information is provided for all 300,000 orthodox Christian churches.1 1 This presentation looks only at people attending orthodox Christian churches. Approximately 3 million people attend non-orthodox Christian churches, and perhaps 3 million attend a religious service of another religion. Those ‘houses of worship’ would add another 35,000 churches in the United States and increase the 2000 percentage to 20.5%. © 2004 by David T. Olson Sample - Not for Public Use
For More Information . . . • Presentations such as this are available for the largest 100 metropolitan areas, for each state and for the nation as a whole, as well as other presentations to show what is happening in the American church. Presentations are available either by direct download, CD or print. Please go to www.The AmericanChurch.org for ordering information. • To Contact Dave Olson, please email him at DaveTOlson@aol.com. © 2004 by David T. Olson Sample - Not for Public Use