Download
1 / 44
520 likes | 758 Views
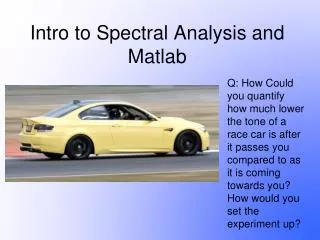
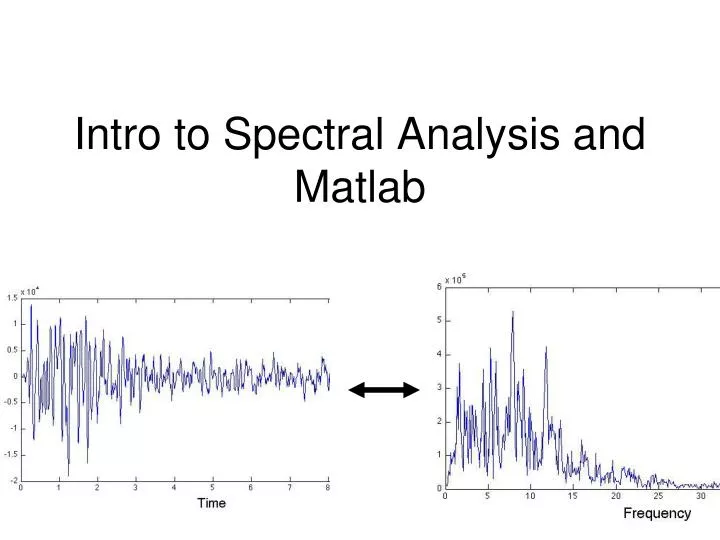
Intro to Spectral Analysis and Matlab. Time domain. Seismogram - particle position over time. Amplitude. Time. Frequency domain. Why might frequency be as or more important than amplitude? Filtering signal from noise Understanding earthquake source, propagation effects Ground shaking.

E N D
Time domain • Seismogram - particle position over time Amplitude Time
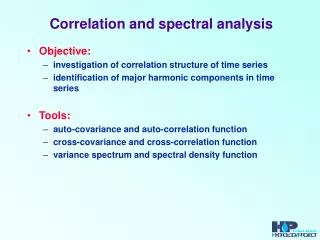
Frequency domain • Why might frequency be as or more important than amplitude? • Filtering signal from noise • Understanding earthquake source, propagation effects • Ground shaking
Time domain <-> Frequency domain • Possible to mathematically transform from time to frequency domain • Relative importance of the frequencies contained in the time series • Can completely describe the system either way. • Goal of today’s lab • Begin to become familiar with describing seismograms in either time or frequency domains • Will leave out most of the mathematics
To create arbitrary seismogram • Becomes integral in the limit • Fourier Transform • Computer: Fast Fourier Transform - FFT
Sampling Frequency • Digital signals aren’t continuous • Sampled at discrete times • How often to sample? • Big effect on data volume
Aliasing FFT will give wrong frequency
Nyquist frequency • Can only accurately measure frequencies <1/2 of the sampling frequency • For example, if sampling frequency is 200 Hz, the highest theoretically measurable frequency is 100 Hz • How to deal with higher frequencies? • Filter before taking spectra
Summary • Infinite sine wave is spike in frequency domain • Can create arbitrary seismogram by adding up enough sine waves of differing amplitude, frequency and phase • Both time and frequency domains are complete representations • Can transform back and forth - FFT • Must be careful about aliasing • Always sample at least 2X highest frequency of interest
Basin Thickness • 110 m/s /2.5 Hz = 44 m wavelength • Basin thickness = 11 m • 80 m/s /1 Hz = 80 m • Basin thickness = 20 m
Station LKWY, Utah raw Filtered 2-19 Hz Filtered twice
Station LKWY, Utah raw Filtered 2-19 Hz Filtered twice