Download
1 / 54
540 likes | 754 Views
Practical application of population health and wellbeing approaches in the new policy context. Professor Chris Bentley. HINST Associates. Messages from the Past. Physiological risks High blood pressure High cholesterol Stress hormones Anxiety/depression. Well being and Health.

E N D
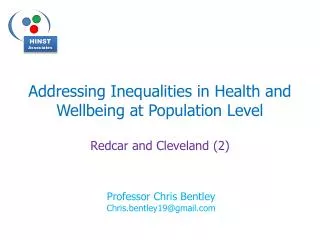
Practical application of population health and wellbeing approaches in the new policy context Professor Chris Bentley HINST Associates
Physiological risks High blood pressure High cholesterol Stress hormones Anxiety/depression Well being and Health Behavioural risks Smoking Poor diet Lack of activity Substance abuse Risk conditions – e.g.: Poverty Low social status Unemployment Dangerous environments Discrimination Steep power heirarchy Gaps/weaknesses in services and support Psycho-social risks: Isolation Lack of social support Poor social networks Low self-esteem High self-blame Low perceived power Loss of meaning/purpose of life Ronald Labonte
Health Inequalities Different Gestation Times for Interventions For example intervening to reduce risk of mortality in people with established disease such as CVD, cancer, diabetes A For example intervening through lifestyle and behavioural change such as stopping smoking, reducing alcohol related harm and weight management to reduce mortality in the medium term B For example intervening to modify the social determinants of health such as worklessness, poor housing, poverty and poor education attainment to impact on mortality in the long term C 2005 2010 2015 2020
Population Level Interventions Systematic community engagement Systematic and scaled interventions through services Partnership, Vision and Strategy, Leadership and Engagement Intervention Through Services Intervention Through Communities Service engagement with the community Producing Percentage Change at Population Level C. Bentley 2007
Achieving Percentage Change in Population Outcomes Programme characteristics will include being :- • Evidence based – concentrate on interventions where research findings and professional consensus are strongest • Outcomes orientated – with measurements locally relevant and locally owned • Systematically applied – not depending on exceptional circumstances and exceptional champions • Scaled up appropriately – “industrial scale” processes require different thinking to small “ bench experiments” • Appropriately resourced – refocus on core budgets and services rather than short bursts of project funding • Persistent – continue for the long haul, capitalising on, but not dependant on fads, fashion and policy priorities
Health and Wellbeing Boards A shaky start?
A few early concerns • Limited membership v. unmanageably large • JSNAs very variable; not bottom-up and top-down; not driving the agenda • Little knowledge or acknowledgement of Public Health Outcomes Framework • Role not clear: strategic ‘forum’ (talking shop), or performance managing function • Early HWS pink and fluffy; missing tangible stated outcomes with strategy for delivery • Who is accountable for delivery of each priority to the Board • Missing opportunities on ‘causes of the causes’
“ Social injustice is killing on a grand scale “ Sir Michael Marmot 2010 With thanks to Mike Grady University College London/ Marmot Review Team
Inequality in Early Cognitive Development of British Children in the 1970 Cohort, 22 months to 10 years High SES Low SES High Q at 22m Low Q at 22m Source: Feinstein, L. (2003) ‘Inequality in the Early Cognitive Development of British Children in the 1970 Cohort’, Economica (70) 277, 73-97
Per cent achieving 5+ A* - C grades inc Maths and English at GCSE by IDACI decile of pupil residence: England 2007 % achieving 5+ A*-C GCSEs inc Maths and English Most deprived Income Deprivation Affecting Children Index (IDACI) Least deprived Source: DCFS 2009
Clinical Commissioning Groups Inherent Schizophrenia?
A few early concerns • Commissioner v Provider v Collaborative Partner • Unequal pressures • Leaders (hard-bitten experience v fresh faced enthusiast) • Corporate memory v re-inventing wheels (flat tyres) • Holistic overview v PPPs (personal perspective priorities) • Transition (empowering possibilities) v Real World (reality/austerity bites) • Variable mix of support/advice/guidance (CSS; NHS CBA; PH/PHE; Commercial sector) • Little previous engagement with population perspective
Primary Care Contribution to Health Improvement NHS Commissioning Board Primary Care Direct Action HWBB JSNA HWBS Commissioning Primary Care Commissioned Service CCG contribution
Outline • What is our ambition? What realistic but testing target are we aiming for? • Can this be stated in terms that are easily understood and ‘owned’ by local stakeholders? In particular can it be pinned down to numbers? • What are the main contributory factors responsible for the current adverse situation? • What interventions could contribute substantially to these sort of numbers? Can they be delivered with sufficient system, scale and sustainability • Can a realistic business case be developed to demonstrate appropriate return on investment?
Case Study 1 Oldham CCG
Setting Ambitions: Best in Peer Group (Males) Male All Age All Cause Mortality (AAACM) Rates by GP Consortia, 2007-09 Oldham South Birmingham *Peer group = Former Spearhead PCTs in ‘Centres with Industry’ ONS area classification
Estimating the scale of the challenge (Males) Oldham Male AAACM rate 2001-2009, forecast and trajectory to 2013-15 ambition 270 fewer deaths in 2013-15 expected based on current trend Equivalent to 417 (13%) fewer male deaths in 2013-15
Estimating the scale of the challenge : Summary Reductions in mortality numbers necessary to meet 2013-15 targets
Identifying ‘excess’ mortality by age group Source: Derived from London Public Health Observatory Health Inequalities Intervention Tool data
Identifying ‘excess’ mortality by cause Females Males Source: Derived from NCHOD standardised mortality ratios (SMR) and mortality numbers by age and cause. Excess mortality = ‘observed’ minus ‘expected’ deaths
Potential impact of evidence-based interventions on reducing mortality numbers NNT = Number Needed to Treat to postpone one death
Using the model: a worked example (1) Aim: Deliver a short-term plan to place the PCT on a target AAACM trajectory for males The Plan:Focus on six evidence based interventions: • Full implementation of evidence based treatments for patients with CVD who are currently untreated • Full implementation of evidence based treatments for patients with CVD who are currently partially treated • Finding and treating undiagnosed hypertensives • Moving patients on Atrial Fibrillation registers from aspirin to warfarin • Statins to address CVD risk among COPD patients. • Reducing blood sugar in diabetic patients Expected Outcomes • Improved management of primary and secondary prevention of CVD • Postponement of up to 257 deaths from CVD if the interventions are fully implemented, although this would depend on pace of incremental delivery • Achieving 38% of full implementation of all interventions would deliver the AAACM target although again this depends on pace of incremental delivery Source: Rochdale PCT AAACM Recovery Plan, Nov 2010
Using the model: a worked example (3) • Intervention: • Statins to address CVD risk among patients with mild or moderate COPD • Evidence Base: Observational studies show CVD is the leading cause of mortality among patients with mild and moderate COPD, yet CVD risk is often untreated among this patient group • Treatment population: • Aim to increase coverage from 26% to 66% of all COPD patients. (Current treatment coverage of 26% estimated from local audit of COPD registers plus estimate of undiagnosed COPD from APHO prevalence estimate.) Equates to an additional 2,450 COPD patients on a statin • Outcomes: • Estimated 55 deaths prevented(consistent with model which shows effect of additional 40% COPD patients on a statin) • Costs: • Recurrent costs of £95,000 (includes finding additional patients)
Case Study 2 Atypical situation – Blackpool PCT
Setting Ambitions: Best in Peer Group (Males) Male All Age All Cause Mortality (AAACM) Rates by GP Consortia, 2008-10 *Peer group = PCTs in ‘Costal and Countryside ’ ONS area classification
Setting Ambitions: Best in Peer Group (Males) Male All Age All Cause Mortality (AAACM) Rates by GP Consortia, 2008-10 *Peer group = Former Spearheads in the NHS North West Clinical Commissioning groups
Estimating the scale of the challenge : Summary Reductions in mortality numbers necessary to meet 2014-16 targets
Potential impact of evidence-based interventions on reducing mortality numbers NNT = Number Needed to Treat to postpone one death
Proportionate Need for Levels of ARH Service (not to scale) er Tier 4 Tier 4 Tier 3 Tier 3 Tier 2 Tier 2 Tier 1 Tier 1 Average Borough Blackpool
Case Study 3 Good average health with pockets of deprivation Kent CC
All age, all cause mortality rates, 3-year averages, Kent & Medway
Swale: Causes of excess mortality, worst quintile compared to rest
Primary Care Contribution to Health Improvement NHS Commissioning Board Primary Care Direct Action Primary Care Commissioned Service HWB JSNA HWBS Commissioning CCG contribution
Commissioning Services to Achieve Best Population Outcomes Optimal Population Outcome Challenge to Providers Population Focus 5. Engaging the public 10. Supported self-management 13.Networks,leadership and coordination 9. Responsive Services 4. Accessibility 2. Local Service Effectiveness 7. Expressed Demand 6.Known Population Needs 1.Known Intervention Efficacy 12. Balanced Service Portfolio 8. Equitable Resourcing 3.Cost Effectiveness 11.Adequate Service Volumes C Bentley 2007
Identifying Primary Care performance to outcomes QOF registered prevalence and CHD Mortality(<75)in Oldham (MSOAs) 48
Disease management provided according to evidence-based protocols e.g. NSFs or NICE guidance High Risk High Risk Have LTC Have LTC Aware of LTC Aware of LTC Eligible for treatment Eligible for treatment Optimal treatment Compliant with treatment Compliant with treatment 5.7m 2.6m 2.3m 1.3m 1m CHD 10.2 m 10.2 m 2.8m 1.8m 1.8m Diabetes 19.9 m 19.9 m 0.4m Not known 2.6 m 0.9m CHF 0.48m 0.21m 0.1m 0.08m 2.9m COPD 17.1 m 0.9m 0.52m 0.26m 0.14m NOTE: Figures are for UK. Taken from Harrison W, Marshall T, Singh D & Tennant R “The effectiveness of healthcare systems in the UK – scoping study”; Department of Public Health & Epidemiology and HSMC University of Birmingham, July 2006. 49