Download
1 / 1
10 likes | 87 Views
# 128.51. HOW ATTENTION TO GAZE-DIRECTION IS CAPTURED BY STATIC PICTURES IN VERY YOUNG CHILDREN WITH ASDS: A TIME-COURSE ANALYSIS

E N D
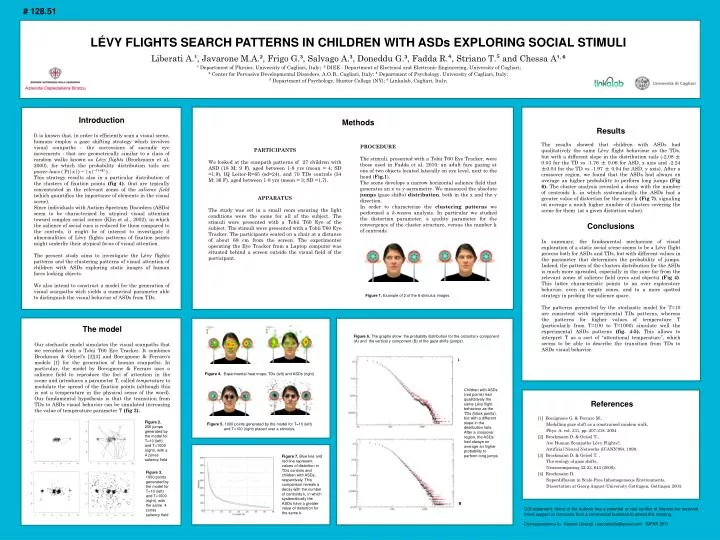
# 128.51 HOW ATTENTION TO GAZE-DIRECTION IS CAPTURED BY STATIC PICTURES IN VERY YOUNG CHILDREN WITH ASDS: A TIME-COURSE ANALYSIS Fadda R.**, Doneddu G.*, Striano, T., ***, Congiu S.*, Frigo G.*, Salvago A. * * Center for Pervasive Developmental Disorders, A.O.B., Cagliari, Italy; ** Department of Psychology, University of Cagliari (CA); ***Department of Psychology, Hunter College (NY) LÉVY FLIGHTS SEARCH PATTERNS IN CHILDREN WITH ASDs EXPLORING SOCIAL STIMULI Liberati A.¹, Javarone M.A.², Frigo G.³, Salvago A.³, Doneddu G.³, Fadda R.⁴, Striano T.⁵ and Chessa A¹, ⁶¹ Department of Physics, University of Cagliari, Italy;²DIEE - Department of Electrical and Electronic Engineering, University of Cagliari; ³Center for Pervasive Developmental Disorders, A.O.B., Cagliari, Italy; ⁴ Department of Psychology, University of Cagliari, Italy; ⁵ Department of Psychology, Hunter College(NY); ⁶Linkalab, Cagliari, Italy; Introduction It is known that, in order to efficiently scan a visual scene, humans employ a gaze shifting strategy which involves visual scanpaths - the successions of saccadic eye movements - that are geometrically similar to a class of random walks known as Lévy flights (Brockmann et al, 2000), for which the probability distribution tails are power-laws ( P(|x|) ~ |x|⁻⁽¹⁺ª⁾ ). This strategy results also in a particular distribution of the clusters of fixation points (fig 4), that are typically concentrated in the relevant zones of the salience field (which quantifies the importance of elements in the visual scene). Since individuals with Autism Spectrum Disorders (ASDs) seem to be characterized by atypical visual attention toward complex social scenes (Klin et al., 2002), in which the salience of social cues is reduced for them compared to the controls, it might be of interest to investigate if abnormalities of Lèvy flights patterns of fixation points might underlie their atypical focus of visual attention. The present study aims to investigate the Lévy flights patterns and the clustering patterns of visual attention of children with ASDs exploring static images of human faces looking objects. We also intend to construct a model for the generation of visual scanpaths wich yields a numerical parameter able to distinguish the visual behavior of ASDs from TDs. Methods Results The results showed that children with ASDs had qualitatively the same Lévy flight behaviour as the TDs, but with a different slope in the distribution tails (-2.08 ± 0.03 for the TD vs -1.76 ± 0.06 for ASD, x axis and -2.24 ±0.04 for the TD vs -1.97 ± 0.04 for ASD, y axis). After a crossover region, we found that the ASDs had always on average an higher probability to perform long jumps (Fig 6). The cluster analysis revealed a decay with the number of centroids k, in which systematically the ASDs had a greater value of distortion for the same k (Fig 7), signaling on average a much higher number of clusters covering the scene for them (at a given distortion value). Conclusions In summary, the fundamental mechanism of visual exploration of a static social scene seems to be a Lévy flight process both for ASDs and TDs, but with different values in the parameter that determines the probability of jumps. Indeed, the pattern of the clusters distribution for the ASDs is much more spreaded, especially in the zone far from the relevant zones of salience field (eyes and objects) (Fig 4). This latter characteristic points to an over exploratory behavior, even in empty zones, and to a more spotted strategy in probing the salience space. The patterns generated by the stochastic model for T=10 are consistent with experimental TDs patterns, whereas the patterns for higher values of temperature T (particularly from T=100 to T=1000) simulate well the experimental ASDs patterns (fig. 4-5). This allows to interpret T as a sort of "attentional temperature”, which seems to be able to describe the transition from TDs to ASDs visual behavior. PROCEDURE The stimuli, presented with a Tobii T60 Eye Tracker, were those used in Fadda et al. 2010: an adult face gazing at one of two objects located laterally on eye level, next to the head(Fig.1). The scene develops a narrow horizontal salience field that generates an x vs y asymmetry. We measured the absolute jumps (gaze shifts) distribution, both in the x and the y direction. In order to characterize the clustering patterns we performed a k-means analysis. In particular we studied the distortion parameter, a quality parameter for the convergence of the cluster structure, versus the number k of centroids. PARTICIPANTSWe looked at the scanpath patterns of 27 children with ASD (18 M; 9 F), aged between 1-8 yrs (mean = 4; SD =1,9), IQ Leiter-R=65 (sd=24), and 70 TDs controls (34 M; 36 F), aged between 1-8 yrs (mean = 3; SD =1,7). APPARATUSThe study was set in a small room ensuring the light conditions were the same for all of the subject. The stimuli were presented with a Tobii T60 Eye of the subject. The stimuli were presented with a Tobii T60 Eye Tracker. The participants seated on a chair at a distance of about 68 cm from the screen. The experimenter operating the Eye Tracker from a Laptop computer was situated behind a screen outside the visual field of the participant. Figure 1. Example of 2 of the 8 stimulus images The model Our stochastic model simulates the visual scanpaths that we recorded with a Tobii T60 Eye Tracker. It combines Brockman & Geisel's [2][3] and Boccignone & Ferraro's models [1] for the generation of human scanpaths. In particular, the model by Boccignone & Ferraro uses a salience field to reproduce the foci of attention in the scene and introduces a parameter T, called temperature to modulate the spread of the fixation points (although this is not a temperature in the physical sense of the word). Our fundamental hypothesis is that the transition from TDs to ASDs visual behavior can be simulated increasing the value of temperature parameter T (fig 2). Figure 6. The graphs show the probabilty distribution for the orizontal x component (A) and the vertical y component (B) of the gaze shifts (jumps). A Figure 4. Experimental heat maps: TDs (left) and ASDs (right) Children with ASDs (red points) had qualitatively the same Lévy flight behaviour as the TDs (black points), but with a different slope in the distribution tails. After a crossover region, the ASDs had always on average an higher probability to perform long jumps References [1] Boccignone G. & Ferraro M., Modelling gaze shift as a constrained random walk, Phys. A, vol. 331, pp. 207-218, 2004 [2] Brockmann D. & Geisel T., Are Human Scanpaths Lévy Flights?, Artificial Neural Networks (ICANN'99), 1999. [3] Brockmann D. & Geisel T. , The ecology of gaze shifts, Neurocomputing 32-33, 643 (2000). [4] Brockmann D, Superdiffusion in Scale-Free Inhomogeneous Environments, Dissertation at Georg-August-University Gottingen, Gottingen 2003. Figure 2. 200 jumps generated by the model for T=10 (left) and T=1000 (right), with a 4 zones saliency field Figure 5. 1000 points generated by the model for T=10 (left) and T=100 (right) placed over a stimulus. Figure 7. Blue line and red line represent values of distortion in TDs controls and children with ASDs, respectively. This comparison reveals a decay with the number of centroids k, in which systematically the ASDs have a greater value of distortion for the same k. Figure 3. 1000 points generated by the model for T=10 (left) and T=1000 (right), with the same 4 zones saliency field B COI statement: None of the authors has a potential or real conflict of interest nor received travel support or honoraria from a commercial business to attend this meeting. Correspondence to: Alessio Liberati roscoelestis@gmail.com IMFAR 2011