Download
1 / 25
250 likes | 578 Views
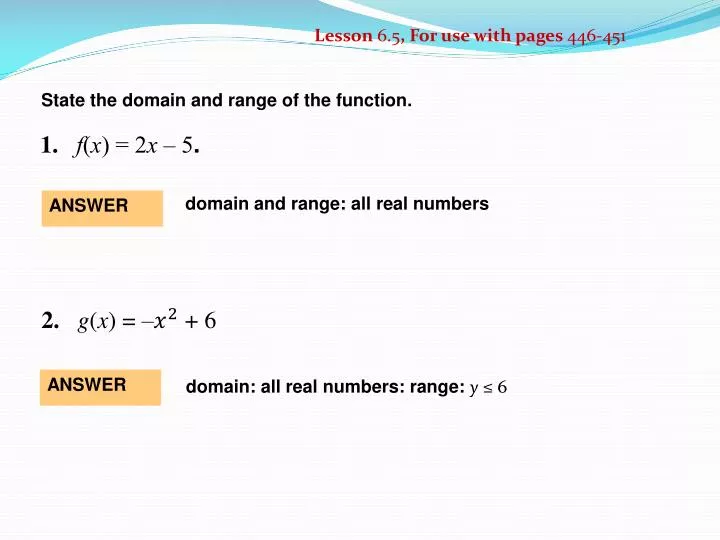
Lesson 6.5 , For use with pages 446-451. State the domain and range of the function. . 1. f ( x ) = 2 x – 5 . domain and range: all real numbers. ANSWER. 2. g ( x ) = – + 6. ANSWER. domain: all real numbers: range: y ≤ 6. 1 . – . 3. y = 8 . 2 .

E N D
Lesson 6.5, For use with pages 446-451 State the domain and range of the function. 1.f(x) = 2x – 5. domain and range: all real numbers ANSWER 2.g(x) = –+ 6 ANSWER domain: all real numbers: range: y ≤6
1 – 3.y = 8. 2 Lesson 6.5, For use with pages 446-451 State the domain and range of the function. domain: all real numbers: range:y ≤ –8 ANSWER
Alg II 6.5 PP Graphing Square Roots (Radicals)
Graph y = and state the domain and range. Compare the graph with the graph of y = Make a table of values and sketch the graph. 1 2 EXAMPLE 1 Graph a square root function SOLUTION
x The radicand of a square root must be nonnegative. So, the domain is x ≥ 0.The range is y ≥ 0. The graph of y =is a vertical shrink of the graph of y = by a factor of . 1 1 2 2 EXAMPLE 1 Graph a square root function
Graph y =–3 , and state the domain and range. Compare the graph with the graph of y =. Make a table of values and sketch the graph. EXAMPLE 2 Graph a cube root function SOLUTION
3 3 x x The graph of y = – 3 is a vertical stretch of the graph of y = by a factor of 3 followed by a reflection in the x-axis. EXAMPLE 2 Graph a cube root function The domain and range are all real numbers.
Pendulums The periodof a pendulum is the time the pendulum takes to complete one back-and-forth swing. The period T(in seconds) can be modeled by T = 1.11 where l is the pendulum’s length (in feet). • Use a graphing calculator to graph the model. • How long is a pendulum with a period of 3 seconds? EXAMPLE 3 Solve a multi-step problem
STEP 1 STEP 2 Use the trace feature to find the value of xwhen y = 3.The graph shows x 7.3. Graph the model. Enter the equation y = 1.11 . The graph is shown below. EXAMPLE 3 Solve a multi-step problem SOLUTION
ANSWER A pendulum with a period of 3 seconds is about 7.3 feet long. EXAMPLE 3 Solve a multi-step problem
1. y = – 3 Make a table of values and sketch the graph. ANSWER y< 0 Domain: x >0 Range: for Examples 1, 2 and 3 GUIDED PRACTICE SOLUTION
x 2. y = 1 4 ANSWER y< 0 Domain: x >0 Range: for Examples 1, 2 and 3 GUIDED PRACTICE SOLUTION Make a table of values and sketch the graph.
– x 3. y = 3 SOLUTION Make a table of values and sketch the graph. ANSWER 1 Domain: All real numbers Range: All real numbers 2 for Examples 1, 2 and 3 GUIDED PRACTICE
4. g(x)= 4 SOLUTION Make a table of values and sketch the graph. ANSWER Domain: All real numbers Range: All real numbers for Examples 1, 2 and 3 GUIDED PRACTICE
5. What if ? Use the model in example 3 to find the length of a pendulum with a period of 1 second. ANSWER About 0.8 ft for Examples 1, 2 and 3 GUIDED PRACTICE
Sketch the graph of y = –2 (shown in blue). Notice that it begins at the origin and passes through the point (1, –2). EXAMPLE 4 Graph a translated square root function Graph y = -2 +2.Then state the domain and range. SOLUTION STEP 1
STEP 2 Translate the graph. For y = - 2 +2 , h = 3 and k = 2. So, shift the graph of y = –2 right 3 units and up 2 units. The resulting graph starts at (3, 2) and passes through (4, 0). EXAMPLE 4 Graph a translated square root function From the graph, you can see that the domain of the function is x ≥ 3 and the range of the function is y ≤ 2.
Graph y = 3 3x + 4 – 1. Then state the domain and range. Sketch the graph of y = 3 3x(shown in blue). Notice that it begins at the origin and passes through the point (–1, –3) and (1, 3). EXAMPLE 5 Graph a translated cube root function SOLUTION STEP 1
STEP 2 Translate the graph. Note the for y = –3 3x + 4 – 1, h = –4 and k = –1. So, shift the graph of y = 3 3xleft 4 units and up 1 unit. The resulting graph starts at (–5, –4),(–4, –1) and passes through (–3, 2). EXAMPLE 5 Graph a translated cube root function From the graph, you can see that the domain and range of the function are both all real numbers.
6. ANSWER y= –4 Domain :x > 0 ,range : y < 0. x + 2 for Examples 4 and 5 GUIDED PRACTICE Graph the function. Then state the domain and range.
7. y = 2 x + 1 ANSWER Domain :x > –1 ,range : y > 0. for Examples 4 and 5 GUIDED PRACTICE Graph the function. Then state the domain and range.
8. x – 3 – 1 f(x) = ANSWER Domain :x > 3 ,range : y > –1. 1 2 for Examples 4 and 5 GUIDED PRACTICE Graph the function. Then state the domain and range.
9. 2 x – 4 3 ANSWER Domain :all real numbers, range: all real numbers. for Examples 4 and 5 GUIDED PRACTICE Graph the function. Then state the domain and range. y =
10. x – 5 3 for Examples 4 and 5 GUIDED PRACTICE Graph the function. Then state the domain and range. y = ANSWER Domain :all real numbers, range: all real numbers.
11. g(x) = x + 2 – 3 3 ANSWER Domain :all real numbers, range: all real numbers. for Examples 4 and 5 GUIDED PRACTICE Graph the function. Then state the domain and range.