Download

1 / 23
230 likes | 474 Views
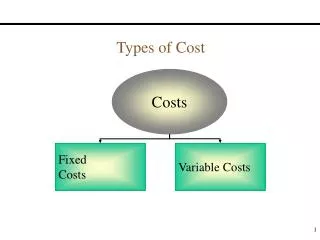
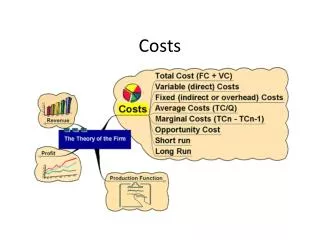
Costs. Short run curves. Costs ($). AFC. AVC. MC. TC=SRAC. LRAC. costs. output. Economies of scale Increasing RETURNS to scale. “Output increases at a proportionally higher rate than the increase costs per unit”. costs. output.

E N D
Short run curves Costs ($) AFC AVC MC TC=SRAC
LRAC costs output
Economies of scaleIncreasing RETURNS to scale • “Output increases at a proportionally higher rate than the increase costs per unit” costs output Increase productivity through specialization, bulk buying, etc. Allows the company to expand easily.
Constant Returns to Scale • “Output increases at the same proportion rate as the increase of costs per unit” costs output Not an advantage, nor an obstacle
Decreasing Returns to Scale • “Output increases in less than proportionally as the proportion increased in the costs of F.O.P.s per unit” costs output Management problems, big investments in larger machines than needed, obsolete machines .
REVENUE TR Total Rev • TOTAL REVENUE: TR = P * Q sold • MARGINAL REVENUE: MR = ∆TR/∆Q sold • AVERAGE REVENUE: AR = TR / Q sold ¿PRICE? = MR AND AR in perfect competitive firm. Q Rev /unit $ 3 1 3 5 10 Q
PROFITS • TP = TR – TC Firms want to maximize profits? A profit maximizing firm will. There are other goals: - Sales Maximizing - Revenue Maximizing - Environmental concerns
PROFIT Profits increase = MRev > MC A unit of production raises profits, if the Marginal Revenue obtained of selling it exceeds the Marginal Cost of producing it.
Profits decrease = MRev < MC A unit of production lowers profits if the marginal revenue of selling it is less than the marginal cost of producing it.
NORMAL PROFITS VRS SUPERNORMAL PROFITS • If profit is more than the economic cost then the firm is gaining supernormal profits. • If profits are greater than cero, se firm is earning supernormal profits. The industry attracts more firms. • Less than cero, is an economic loss. Firms leave the industry.
The UK Electricity Market Powergen announced in October 2002 that it planned to shut-down more than a quarter of its UK power stations, mothballing sufficient capacity to provide electricity for the whole of London. The company said the electricity market was “bust” after a price slump. Powergen will close the power station on the Isle of Grain in Kent and the Killingholme plant in Lincolnshire. UK electricity prices have fallen by almost 40 per cent since 1998 as a result of intense competition and the introduction of new trading arrangements, which have coincided with a decline in industry demand. Powergen said that it was receiving between £13 and £15 per megawatt hour, compared with a cost of about £18 for gas-fired plant and costs of £40 per MWh for older, inefficient oil-fired plant. The decline in electricity prices has pushed British Energy, the nuclear generator, to the brink of insolvency, forcing the Government to grant a £650 million emergency loan facility.
Shut down price The firm will minimize its losses by maintaining its operation.
Shut down price It is better for the firm to shut down in order to reduce its losses.
LONG RUN • As worker productivity rises, the marginal cost of producing another unit of the good falls. This is shown graphically by a shift in the marginal cost curve from MC0 to MC1
As firms earn economic profits, the entry of new firms leads to an outward shift in the industry supply curve from S0 to S1. However, in the case of a decreasing cost industry, supply shifts out further than demand. This is a result of the falling costs of production due to higher worker productivity. As firms lower there production costs, they earn additional economic profits. Profits that open the door even wider to new competitors.
For a decreasing cost industry, supply shifts outward in the long run due to two reasons: • An increase in demand results in economic profits that attract new firms into the industry. • Technological improvements lead to better capital and higher worker productivity. As worker productivity increases, production costs fall, causing the supply curve to shift rightward. Lower production costs also results in economic profits for existing firms and over time, new firms enter in search of these profits.
In the decreasing cost industry, the supply curve shifts outward for the two reasons listed above. Over time we can look at the long-run equilibrium of the supply and demand curves in order to derive the industry's long-run supply curve.