Download
1 / 1
20 likes | 156 Views
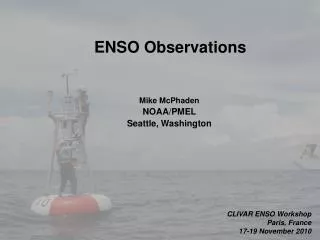
Increasing Amplitude of El N i ñ o in the Central Equatorial Pacific. Michael McPhaden, NOAA/Pacific Marine Environmental Laboratory, Seattle, Washington, USA. Reynolds et al. (2007) ¼-deg. GHRSST. Image Credit PO.DAAC NASA, JPL.

E N D
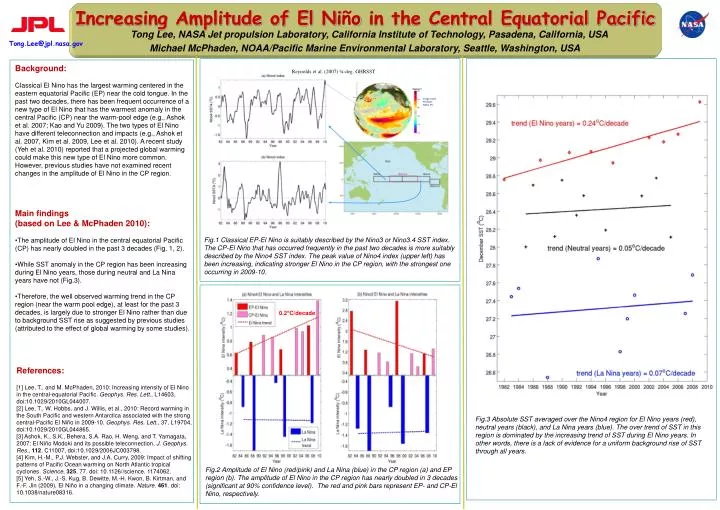
Increasing Amplitude of El Niño in the Central Equatorial Pacific Michael McPhaden, NOAA/Pacific Marine Environmental Laboratory, Seattle, Washington, USA Reynolds et al. (2007) ¼-deg. GHRSST Image Credit PO.DAAC NASA, JPL Tong Lee, NASA Jet propulsion Laboratory, California Institute of Technology, Pasadena, California, USA Tong.Lee@jpl.nasa.gov Background: Classical El Nino has the largest warming centered in the eastern equatorial Pacific (EP) near the cold tongue. In the past two decades, there has been frequent occurrence of a new type of El Nino that has the warmest anomaly in the central Pacific (CP) near the warm-pool edge (e.g., Ashok et al. 2007; Kao and Yu 2009). The two types of El Nino have different teleconnection and impacts (e.g., Ashok et al. 2007, Kim et al. 2009, Lee et al. 2010). A recent study (Yeh et al. 2010) reported that a projected global warming could make this new type of El Nino more common. However, previous studies have not examined recent changes in the amplitude of El Nino in the CP region. • Main findings • (based on Lee & McPhaden 2010): • The amplitude of El Nino in the central equatorial Pacific (CP) has nearly doubled in the past 3 decades (Fig. 1, 2). • While SST anomaly in the CP region has been increasing during El Nino years, those during neutral and La Nina years have not (Fig.3). • Therefore, the well observed warming trend in the CP region (near the warm pool edge), at least for the past 3 decades, is largely due to stronger El Nino rather than due to background SST rise as suggested by previous studies (attributed to the effect of global warming by some studies). Fig.1 Classical EP-El Nino is suitably described by the Nino3 or Nino3.4 SST index. The CP-El Nino that has occurred frequently in the past two decades is more suitably described by the Nino4 SST index. The peak value of Nino4 index (upper left) has been increasing, indicating stronger El Nino in the CP region, with the strongest one occurring in 2009-10. 0.2°C/decade References: [1] Lee, T., and M. McPhaden, 2010: Increasing intensity of El Nino in the central-equatorial Pacific. Geophys. Res. Lett., L14603, doi:10.1029/2010GL044007. [2] Lee, T., W. Hobbs, and J. Willis, et al., 2010: Record warming in the South Pacific and western Antarctica associated with the strong central-Pacific El Niño in 2009-10. Geophys. Res. Lett., 37, L19704, doi:10.1029/2010GL044865. [3] Ashok, K., S.K., Behera, S.A. Rao, H. Weng, and T. Yamagata, 2007: El Niño Modoki and its possible teleconnection, J. Geophys. Res., 112, C11007, doi:10.1029/2006JC003798. [4] Kim, H.-M., P.J. Webster, and J.A. Curry, 2009: Impact of shifting patterns of Pacific Ocean warming on North Atlantic tropical cyclones. Science, 325, 77. doi: 10.1126//science. 1174062. [5] Yeh, S.-W., J.-S. Kug, B. Dewitte, M.-H. Kwon, B. Kirtman, and F.-F. Jin (2009), El Niño in a changing climate. Nature. 461. doi: 10.1038/nature08316. Fig.3 Absolute SST averaged over the Nino4 region for El Nino years (red), neutral years (black), and La Nina years (blue). The over trend of SST in this region is dominated by the increasing trend of SST during El Nino years. In other words, there is a lack of evidence for a uniform background rise of SST through all years. Fig.2 Amplitude of El Nino (red/pink) and La Nina (blue) in the CP region (a) and EP region (b). The amplitude of El Nino in the CP region has nearly doubled in 3 decades (significant at 90% confidence level). The red and pink bars represent EP- and CP-El Nino, respectively.