Download
1 / 58
590 likes | 826 Views
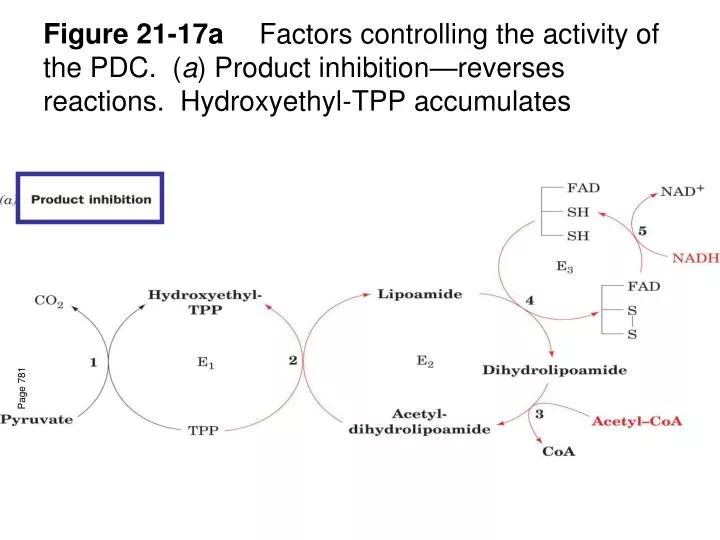
Figure 21-17a Factors controlling the activity of the PDC. ( a ) Product inhibition—reverses reactions. Hydroxyethyl-TPP accumulates. Page 781. Figure 21-17 Factors controlling the activity of the PDC. ( b ) Covalent modification in the eukaryotic complex. Products of FA degradation.

E N D
Figure 21-17a Factors controlling the activity of the PDC. (a) Product inhibition—reverses reactions. Hydroxyethyl-TPP accumulates Page 781
Figure 21-17 Factors controlling the activity of the PDC.(b) Covalent modification in the eukaryotic complex. Products of FA degradation Page 781 Insulin activates phosphatase and ↑ Acetyl CoA Also activates glycogen synthetase
Figure 21-18a Conformational changes in citrate synthase. (a) Space-filling drawing showing citrate synthase in the open conformation. (b) Space-filling drawing showing citrate synthase in the closed, substrate-binding conformation Page 782 Subunits rotate 18◦! INDUCED FIT Opens binding site for Ac-CoA Ordered sequential binding kinetics
Figure 21-19 Mechanism and stereochemistry of the citrate synthase reaction. Asp acts as a base Enol intermediate H shared equally Enolate nucleophillically attacks His 320 donates H+ to OAA and becomes anionic! Page 783 Mixed aldol/Claisen ester condensation ΔGO’ = -31 kJ!! hydrolysis
Citrate synthase analyses • Acetonyl Co A (substrate analog) CoA-S-CH2-CO-CH3 • Carboxymethyl CoA (transition state analog) CoA-S-CH2 –CO2H (resembles enol intermediate)
Figure 21-20 Mechanism and stereochemistry of the aconitase reaction. Alkoxide abstracts H+ Trans elimination of water rehydration Page 784 ↔
Figure 21-21 Probable reaction mechanism of isocitrate dehydrogenase. Requires Mn+2 or Mg+2 Page 785 Ketone is an electron sink Promotes rearragement Intermediate identified in “slow” mutants
Figure 21-22a Reactions catalyzed by succinyl-CoA synthetase. Formation of succinyl phosphate, a “high-energy” mixed anhydride. AKA Succinyl Thiokinase Page 787 succinate
Figure 21-22b Reactions catalyzed by succinyl-CoA synthetase. Formation of phosphoryl–His, a “high-energy” intermediate. Page 787
Figure 21-22c Reactions catalyzed by succinyl-CoA synthetase. Transfer of the phosphoryl group to GDP, forming GTP. Page 787
Summary so far • Acetyl CoA → 2 CO2 • →2 NADH • →1 GTP • Remainder of pathway regenerates OAA
Enzyme? Succinate Fumarate + FAD + FADH2 Inhibited by Malonate
Figure 21-23 Covalent attachment of FAD to a His residue of succinate dehydrogenase. Page 787
Figure 21-24 Possible mechanisms for the hydration of fumarate as catalyzed by fumarase. Page 788
Isotopic Tests: Generation of specifically labeled OAA
OH- carbanion • E + H+ + Fum EH+ + Fum▪OH-E ▪ H+ ▪Mal- 18O exchange E + H+ + Mal
Malate DH • Fumarate → Malate
+CoASH CH3 CH3- COO- C=O CoASH When in the TCA cycle would this label be lost as CO2?
Table 21-2 Standard Free Energy Changes (DG°¢) and Physiological Free Energy Changes (DG) of Citric Acid Cycle Reactions. Page 790
Waltz ‘round the cycle… ...the song
Let's sing!! • http://www.csulb.edu/~cohlberg/songbook.html
Lyrics http://books.google.com/books?id=oq9ENyL_d9YC&printsec=frontcover&source=gbs_v2_summary_r&cad=0#v=onepage&q=&f=false
Figure 21-26 Amphibolic functions of the citric acid cycle. Page 793
Chapter 22: Electron Transport and Oxidative Phosphorylation
OH- carbanion • E + H+ + Fum EH+ + Fum▪OH-E ▪ H+ ▪Mal- 18O exchange E + H+ + Mal
Figure 22-1 The sites of electron transfer that form NADH and FADH2 in glycolysis and the citric acid cycle. Page 798
Figure 22-2a Mitochondria. (a) An electron micrograph of an animal mitochondrion. Page 799
Figure 22-2b Mitochondria. (b) Cutaway diagram of a mitochondrion. Page 799
Figure 22-3 Freeze-fracture and freeze-etch electron micrographs of the inner and outer mitochondrial membranes. Page 799
Figure 22-9 The mitochondrial electron-transport chain. Page 803
Table 22-1Reduction Potentials of Electron-Transport Chain Components in Resting Mitochondria. Page 806
Table 22-1 (continued) Reduction Potentials of Electron-Transport Chain Components in Resting Mitochondria. Page 806
Table 22-1 (continued) Reduction Potentials of Electron-Transport Chain Components in Resting Mitochondria. Page 806
Table 22-1 (continued) Reduction Potentials of Electron-Transport Chain Components in Resting Mitochondria. Page 806
Figure 22-11 Effect of inhibitors on electron transport. Page 805
Figure 22-12 Electron micrographs of mouse liver mitochondria. (a) In the actively respiring state. (b) In the resting state. Page 806
Figure 22-13 Determination of the stoichiometry of coupled oxidation and phosphorylation (the P/O ratio) with different electron donors. Page 807
Figure 22-14The mitochondrial electron-transport chain. Page 808
Figure 22-15 Structures of the common iron–sulfur clusters. (a) [Fe–S] cluster. (b) [2Fe–2S] cluster. (c)[4Fe–4S] cluster. Page 808
Figure 22-17 Oxidation states of the coenzymes of complex I. (a) FMN. (b) CoQ. Page 810
Figure 22-20 Active site interactions in the proposed mechanism of the QFR-catalyzed reduction of fumarate to succinate. Page 812