Download
1 / 4
40 likes | 157 Views
Using FerryMon to develop a WQ data base and scale up for the Pamlico Sound. Chl a is very patchy: 1-May-2002 – 3-July-2002. Latitude (decimal degrees N). 100. 34.96. 40. Chl a m g/L. 30. 34.95. 20. 10. 0. 34.94. ModMon Monitoring spatial and temporal positions. 23-May. 3-Jul.

E N D
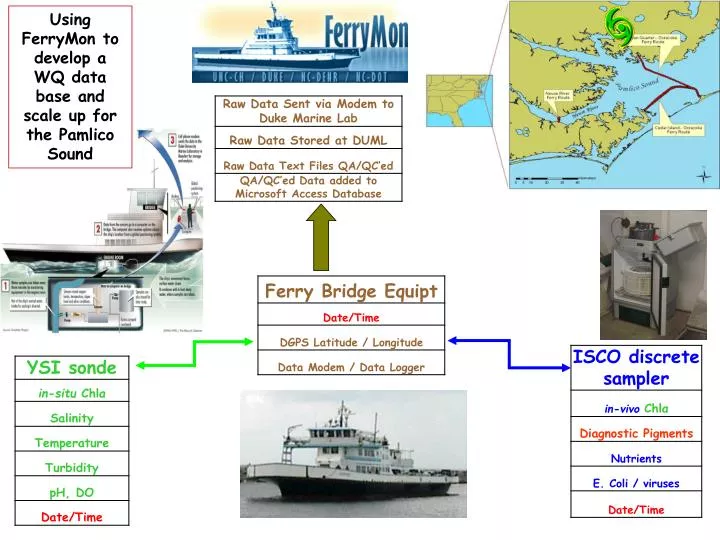
Using FerryMon to develop a WQ data base and scale up for the Pamlico Sound
Chl a is very patchy: 1-May-2002 – 3-July-2002 Latitude (decimal degrees N) 100 34.96 40 Chl amg/L 30 34.95 20 10 0 34.94 ModMon Monitoring spatial and temporal positions 23-May 3-Jul 14-May 13-Jun 23-Jun 4-May 3-Jun Temperature ( 0C) Salinity (ppt) 35 30 25 Temp 20 15 Salinity 10 5 0 River discharge (m3 s-1) 100 80 60 40 20 0
Enabling Advanced Research and Interdisciplinary Collaboration with EPA and NASA. Characterizing algal blooms in 2002 and 2004
Diagnostic Microalgal Indicators and Remote Sensing Estimated Chlorophyll-a and Peridinin concentrations in the Neuse R. Estuary 15 May 2004 as determined with AVIRIS, FerryMon and ModMon data.(Lunetta et al 2006) Users: EPA, NASA, NOAA, NC DENR-DWQ, Researchers, Schools, Stakeholders