Download
1 / 12
130 likes | 135 Views
Motion Graphs. Describing the motion of an object is occasionally hard to do with words. Sometimes graphs help make motion easier to picture and therefore understand. Remember:. Motion is a change in position measured by distance and time. Speed tells us the rate at which an object moves.

E N D
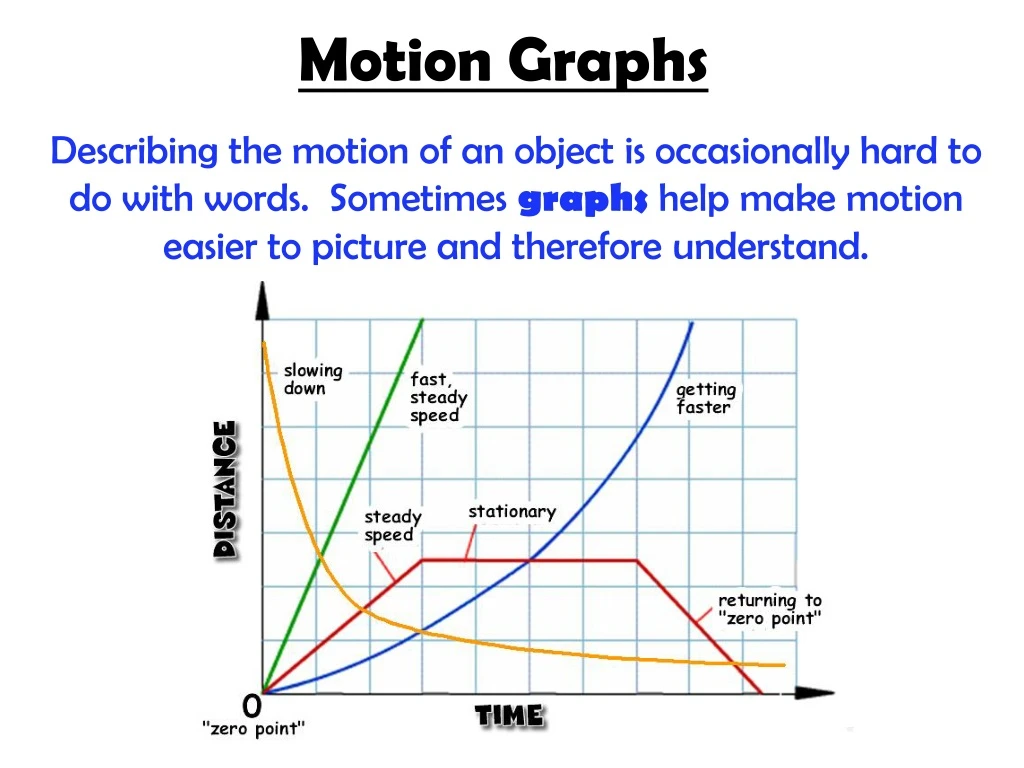
Motion Graphs Describing the motion of an object is occasionally hard to do with words. Sometimes graphs help make motion easier to picture and therefore understand.
Remember: • Motion is a change in position measured by distance and time. • Speed tells us the rate at which an object moves. • Velocity tells the speed and direction of a moving object. • Acceleration tell us the rate speed or direction changes.
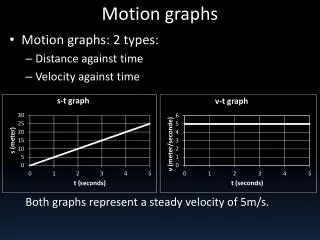
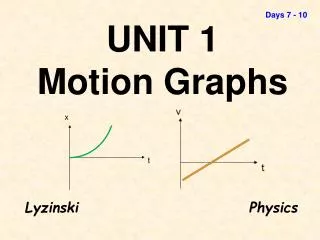
Distance-Time Graphs • Use a line graph to plot distance against time. • Time is always plotted on the X-axis (bottom of the graph). • The further to the right on the axis, the longer the time from start. • Distance is plotted on the Y-axis (left side of the graph). • The higher up the graph, the further from the start.
If you see these graphs… • Time is increasing to the right, but its distance does not change. It is not moving. • We say this object is “at rest.” • If an object is not moving, a horizontal line is shown on a graph.
If an object is moving at a constant speed, it means it has the same increase in distance in a given time. • Time is increasing to the right and distance is increasing constantly with time. The object moves at a constant speed. • Constant speed is shown by a straight, diagonal line on a graph.
Let’s look at 2 moving objects… • Both of the lines in the graph show that each object moved the same distance, but the steeper dashed line got there before the other one. • A steeper slope indicates a larger distance moved in a given time. In other words, higher speed. • Both lines are straight, so both speeds are constant.
The line on this graph is curving upwards. • This shows an increase in speed, since the line is getting steeper. • In other words, in a given time, the distance the object moves is changing (getting larger). It is accelerating.
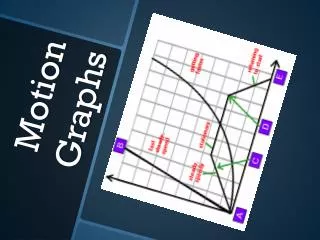
This graph has a lot going on! • At first, the object is traveling at a steady speed. • At 2 sec., the object stops and remains at rest for 6 sec. • The object then returns back to the “zero point.” It arrives there 10 sec. from when it started moving. Distance (m) Time (sec.)
Copy this into your notebook… Graphing Motion • A line graph tells us how far an object has moved with time. • The steeper the slope, the faster the motion. • A horizontal line means the object is at rest. • A curved line means the object is accelerating. • A downward sloping line means the object is returning to the zero point (start).
Ready to try some??? • Which graph would best describe the motion of an object when it was speeding up? • Which graph would best describe the motion of an object when it is moving with a constant speed? • Which graph would best describe the motion of an object when it is at rest?
Let’s make our own motiongraphs!!! • A marathon runner was working on her next 5K time. To the right is a chart listing her times as she passed each kilometer. Create a line graph showing her motion. *** If you finish early, create your own motion story problem. Use Google Slides to show your question and a graph with the solution. Share with your teacher when you are done.