Download
1 / 1
90 likes | 563 Views
AHA Dashboard Executive Summary:. Executive Summary. Meetings & Deliverables. Meetings & Deliverables.

E N D
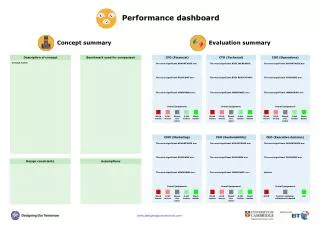
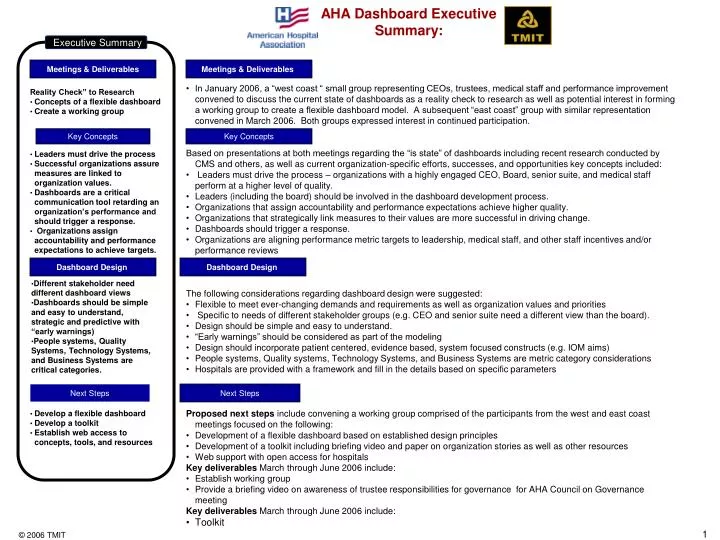
AHA Dashboard Executive Summary: Executive Summary Meetings & Deliverables Meetings & Deliverables • In January 2006, a “west coast “ small group representing CEOs, trustees, medical staff and performance improvement convened to discuss the current state of dashboards as a reality check to research as well as potential interest in forming a working group to create a flexible dashboard model. A subsequent “east coast” group with similar representation convened in March 2006. Both groups expressed interest in continued participation. • Based on presentations at both meetings regarding the “is state” of dashboards including recent research conducted by CMS and others, as well as current organization-specific efforts, successes, and opportunities key concepts included: • Leaders must drive the process – organizations with a highly engaged CEO, Board, senior suite, and medical staff perform at a higher level of quality. • Leaders (including the board) should be involved in the dashboard development process. • Organizations that assign accountability and performance expectations achieve higher quality. • Organizations that strategically link measures to their values are more successful in driving change. • Dashboards should trigger a response. • Organizations are aligning performance metric targets to leadership, medical staff, and other staff incentives and/or performance reviews • The following considerations regarding dashboard design were suggested: • Flexible to meet ever-changing demands and requirements as well as organization values and priorities • Specific to needs of different stakeholder groups (e.g. CEO and senior suite need a different view than the board). • Design should be simple and easy to understand. • “Early warnings” should be considered as part of the modeling • Design should incorporate patient centered, evidence based, system focused constructs (e.g. IOM aims) • People systems, Quality systems, Technology Systems, and Business Systems are metric category considerations • Hospitals are provided with a framework and fill in the details based on specific parameters • Proposed next steps include convening a working group comprised of the participants from the west and east coast meetings focused on the following: • Development of a flexible dashboard based on established design principles • Development of a toolkit including briefing video and paper on organization stories as well as other resources • Web support with open access for hospitals • Key deliverables March through June 2006 include: • Establish working group • Provide a briefing video on awareness of trustee responsibilities for governance for AHA Council on Governance meeting • Key deliverables March through June 2006 include: • Toolkit Reality Check” to Research • Concepts of a flexible dashboard • Create a working group Key Concepts Key Concepts • Leaders must drive the process • Successful organizations assure measures are linked to organization values. • Dashboards are a critical communication tool retarding an organization’s performance and should trigger a response. • Organizations assign accountability and performance expectations to achieve targets. Dashboard Design Dashboard Design • Different stakeholder need different dashboard views • Dashboards should be simple and easy to understand, strategic and predictive with “early warnings) • People systems, Quality Systems, Technology Systems, and Business Systems are critical categories. NextSteps Next Steps • Develop a flexible dashboard • Develop a toolkit • Establish web access to concepts, tools, and resources