Download
1 / 94
940 likes | 1.09k Views
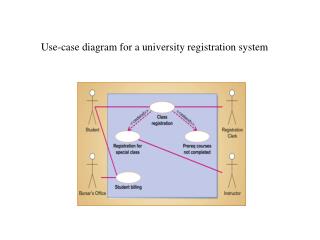
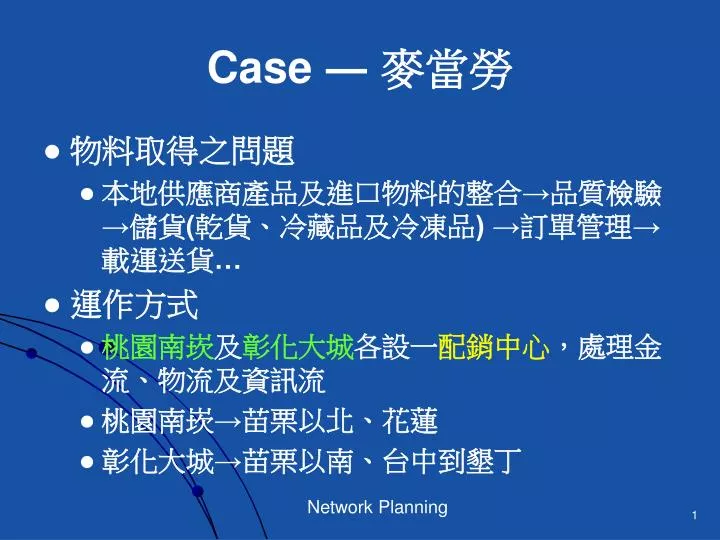
Case ― 麥當勞. 物料取得之問題 本地供應商產品及進口物料的整合 → 品質檢驗 → 儲貨 ( 乾貨、冷藏品及冷凍品 ) → 訂單管理 → 載運送貨 … 運作方式 桃園南崁 及 彰化大城 各設一 配銷中心 ,處理金流、物流及資訊流 桃園南崁 → 苗栗以北、花蓮 彰化大城 → 苗栗以南、台中到墾丁. 物流網路問題 1. 網路設計 該蒐集哪些資料 ? 市場 需求的分佈情況 產品 特性 應該有多少 廠房、倉庫 區位 的規劃 運輸 模式 服務水準 如何設計規劃 ?. 物流網路問題 2. 存貨定位 儲存點 vs. 製造商直送

E N D
Case ― 麥當勞 • 物料取得之問題 • 本地供應商產品及進口物料的整合→品質檢驗→儲貨(乾貨、冷藏品及冷凍品) →訂單管理→載運送貨… • 運作方式 • 桃園南崁及彰化大城各設一配銷中心,處理金流、物流及資訊流 • 桃園南崁→苗栗以北、花蓮 • 彰化大城→苗栗以南、台中到墾丁
物流網路問題1 • 網路設計 • 該蒐集哪些資料? • 市場需求的分佈情況 • 產品特性 • 應該有多少廠房、倉庫 • 區位的規劃 • 運輸模式 • 服務水準 • 如何設計規劃?
物流網路問題2 • 存貨定位 • 儲存點 vs. 製造商直送 • 各儲存點之存貨政策為何? • 資源配置 • 不同產品的製造和包裝之設施來源策略為何? • 每一設施之產能規劃 • 案例 • 國*汽車中壢廠產能不足的因應策略…
Why Network Planning? • Find the right balance betweeninventory, transportation and manufacturingcosts, • Match supply and demandunder uncertaintyby positioning and managing inventoryeffectively, • Utilize resources effectively by sourcing products from the most appropriate manufacturing facility
Three Hierarchical Steps1 • 1、Network design (3.2) • Number, locations and size of manufacturing plants and warehouses • Assignment of retail outlets to warehouses • Major sourcing decisions • Typical planning horizon is a few years.
Three Hierarchical Steps2 • 2 、 Inventory positioning (3.3) • Identifying stocking points • Selecting facilities that will produce to stock and thus keep inventory • Facilities that will produce to order and hence keep no inventory • Related to the inventory management strategies (chapter 2)
Three Hierarchical Steps3 • 3 、 Resource allocation (3.4) • Determine whether production and packaging of different products is done at the right facility • What should be the plants sourcing strategies? • How much capacity each plant should have to meet seasonal demand?
3.2 Network Design • Physical configuration and infrastructure of the supply chain. • A strategic decision with long-lasting effects on the firm. • Decisions relating to plant and warehouselocation as well as distribution and sourcing
案例討論 • **龍擴充產品線組合 • 文具皮件鐘錶女性珠寶 • 問題: • 鐘壞了零件需自香港調貨,請等候一個月! • 文具與女性珠寶的顧客群是否相同?是否應設置不同屬性之門市?
Reevaluation of Infrastructure • Changes in: • demand patterns • product mix • production processes • sourcing strategies • cost of running facilities. • Mergers and acquisitions may mandate the integration of different logistics networks
問題討論 • 泡麵 vs. 三明治 • 第三方物流 vs. 顧客直送
Key Strategic Decisions • Determining the appropriate number of facilities such as plants and warehouses. • Determining the location of each facility. • Determining thesize of each facility. • Allocating space for products in each facility. • Determining sourcing requirements. • Which plant/vendor should produce which product • Determining distribution strategies • Which warehouses should service which customers
Network Design: Objective • The objective of designing logistics network: minimize annual system-wide costs • Production/ purchasing costs • Inventory carrying costs • Facility costs (handling and fixed costs) • Transportation costs • Subject to a variety of service level requirements.
問題討論 • 花蓮地區的麥當勞由桃園南崁或彰化大城之配銷中心負責配送? • ※陽 vs.※瑞的供應商策略…
The Impact of Increasing the Number of Warehouses • Improve service level due to reduction of average service time to customers • Increase inventory costs due to a larger safety stock • Increase overhead and set-up costs • Reduce transportation costs in a certain range • Reduce outbound transportation costs • Increase inbound transportation costs
Industry Benchmarks:Number of Distribution Centers Food Companies Chemicals Pharmaceuticals Avg. # of WH 3 14 25 - High margin product - Service not important (or easy to ship express) - Inventory expensive relative to transportation - Low margin product - Service very important - Outbound transportation expensive relative to inbound Sources: CLM 1999, Herbert W. Davis & Co; LogicTools
A Typical Location Model • There may be an upper bound on the distance between a distribution center and a market area served by it • A set of potential location sites for the new facilities was identified • Costs: • Set-up costs • Transportation cost is proportional to the distance • Storage and handling costs • Production/supply costs
Network Design Tools:Major Components • Mapping • Mapping allows you to visualize your supply chain and solutions • Mapping the solutions allows you to better understand different scenarios • Color coding, sizing, and utilization indicators allow for further analysis • Data • Data specifies the costs of your supply chain • The baseline cost data should match your accounting data • The output data allows you to quantify changes to the supply chain • Engine • Optimization Techniques
Data Collection1 • Locations of customers, retailers, existing warehouses and distribution centers, manufacturing facilities, and suppliers. • All products, including volumes, and special transport modes (e.g., refrigerated). • Annual demand for each product by customer location. • Transportation rates by mode.
Data Collection2 • Warehousing costs, including labor, inventory carrying charges, and fixed operating costs. • Shipment sizes and frequencies for customer delivery. • Order processing costs. • Customer servicerequirements and goals. • Production and sourcingcosts and capacities
Steps of data collection • Data aggregation • Transportation rates • Mileage estimation • Warehouse costs • Warehouse capacities • Potential warehouse locations • Service level requirements • Future demand
Data aggregation • Aggregating Customers • 問題 • 2005年,麥當勞於台灣有355家分店… • 2009年3月,7-11於台灣有4816家店… • Product grouping • 問題:Sun Rise vs. 智利紅酒 vs. 紅酒 vs. 酒類…
Aggregating Customers1 • Customers located in close proximity are aggregated using a grid network or clustering techniques. All customers within a single cell or a single cluster are replaced by a single customer located at the centroid of the cell or cluster. • Five-digit or three-digit zip code based clustering.
Aggregating Customers2 • We refer to a cell or a cluster as a customer zone. • If customers are classified according to their service levels or frequency of delivery, they will be aggregated together by classes. • 例如,家樂福 vs. 7-11
A Strategy for Product Aggregation • Distribution pattern • All products picked up at the same source and destined to the same customers are aggregated together. • Within each of the source-groups, aggregate the SKU’s (stock keeping unit) by similar logistics characteristics • Weight • Volume • Holding Cost • Product type • Variations in product models and style • Same products are packaged in many sizes • These products are typically aggregated together.
案例 • 科學麵、肉燥麵… • 罐裝啤酒、一手、一箱…
Replacing Original Detailed Data with Aggregated Data • Technology exists to solve the logistics network design problem with the original data―例如POS系統… • However • Data aggregation still useful because forecast demand is significantly more accurate at the aggregated level • Aggregating customers into about 150-200 zones usually results in no more than a 1% error in the estimation of total transportation costs
General Rules for Aggregation • Aggregate demand points into at least 200 zones • Holds for cases where customers are classified into classes according to their service levels or frequency of delivery • Make sure each zone has approximately an equal amount of total demand • Zones may be of different geographic sizes. • Place aggregated points at the center of the zone • Aggregate products into 20 to 50 product groups
問題 • 這個月17吋鈻圈車款250部、開天窗車款120部、紅色車款250部… vs. 這個月轎車需求3000部…
Example1 顧客需求量歷史資料 年 1992 1993 1994 1995 1996 1997 1998 顧客1 22,346 28,549 19,567 25,457 31,986 21,897 19,854 顧客2 17,835 21,765 19,875 24,346 22,876 14,653 24,987 加總 40,181 50,314 39,442 49,803 54,862 36,550 44,841
Example2 顧客需求量歷史資料彙總 平均年需求量 年需求標準差 變異係數(δ/μ) 顧客1 24,237 4,658 0.192 顧客2 20,905 3,427 0.173 加總 45,142 6,757 0.150 彙整後的變異較個別變異之加總來得小
Transportation Rates • An important characteristic of a class of rates for truck, rail, UPS and other trucking companies is that the rates are quite linear with the distance but not with volume • 例如,一個人搭Taxi到機楊與4個人搭Taxi到機場的價錢一樣… • Differences between internal rateand external rate
Internal Transportation Rate • For company-owned trucks • Data Required: • Annual costs per truck • Annual mileage per truck • Annual amount delivered • Truck’s effective capacity • Calculate cost per mile per SKU.
External Transportation RateTwo Modes of Transportation1 • Truckload, TL(整車貨件) • Country sub-divided into zones. One zone/state except for: • Big states, such as Florida or New York (two zones) • Zone-to-zone costs provides cost per mile per truckload between any two zones. • TL cost from Chicago to Boston = Illinois-Massachusetts cost per mile X Chicago-Boston distance • TL cost structure is not symmetric • 例如,上山 vs. 下山;逆風 vs.順風…
External Transportation RateTwo Modes of Transportation2 • Less-Than-Truckload, LTL(零擔貨件) • 指託運的貨物裝不滿一個運貨卡車或是託運貨品的重量未達到一般運貨卡車業所指一車的滿載量。如達滿載量,通常會給貨主一個折扣價。 • LTL運輸費率有三種:等級(class)、例外(exception)及大宗貨品(commodity)
External Transportation RateTwo Modes of Transportation3 • Less-Than-Truckload, LTL(零擔貨件) • Class rates1 • standard rates for almost all products or commodities shipped. • Classification tariff(分類價格表)system that gives each shipment a rating or a class. • Factors involved in determining a product’s specific class include: • product density, ease or difficulty of handling and transporting, and liability for damage.
External Transportation RateTwo Modes of Transportation4 • Less-Than-Truckload, LTL(零擔貨件) • Class rates2 • After establishing rating, identify rate basis number(評等基礎數目). • Approximate distance between the load’s origin and destination. • With the two, determine the specific rate per hundred pounds (hundred weight, or cwt) from a carrier tariff table (i.e., a freight rate table).
External Transportation RateTwo Modes of Transportation5 • Less-Than-Truckload, LTL(零擔貨件) • Exception rates providesless expensive rates • Commodity rates are specialized commodity-specific rates
Mileage Estimation • Street Network • Straight line distances
(lonb, latb) Dab (lona, lata) Straight-line Distances Estimation1 • lona: longitude of point a • lata: latitude of point a • Dab: straight-line distance in miles from a to b
Straight-line Distances Estimation2 • Short distances (does not take into account the curvature of the earth) • 美國地區1個經緯度之大約英哩數:69
Straight-line Distances Estimation2 • Long distances (correct for the earth’s curvature)
Circuity Factor(迂迴係數), ρ • Equations underestimate the actual road distance. • Multiply Dabby ρ. • Typical values: • ρ= 1.3 in metropolitan areas • ρ= 1.14 for the continental United States
Chicago-Boston Distance • lonChicago = -87.65 • latChicago = 41.85 • lonBoston = -71.06 • latBoston = 42.36 • DChicago, Boston = 855 miles • Multiply by circuity factor = 1.14 • Estimated road distance = 974 miles • Actual road distance = 965 miles • GIS systems provide more accuracy • However,slows down the systems • Above approximation good enough!
Warehouse Costs • Handling costs • Labor and utility costs • Proportional to annual flow through the warehouse. • Fixed costs • All cost components not proportional to the amount of flow • Typically proportional to warehouse size (capacity) but in a nonlinear way. • Storage costs • Inventory holding costs • Proportional to average positive inventory levels.
Annual sales Inventory turnover ratio= Average inventory level Determining Storage Costs • Multiply average inventory level by holding cost = annual storage costs