Download
1 / 41
410 likes | 489 Views
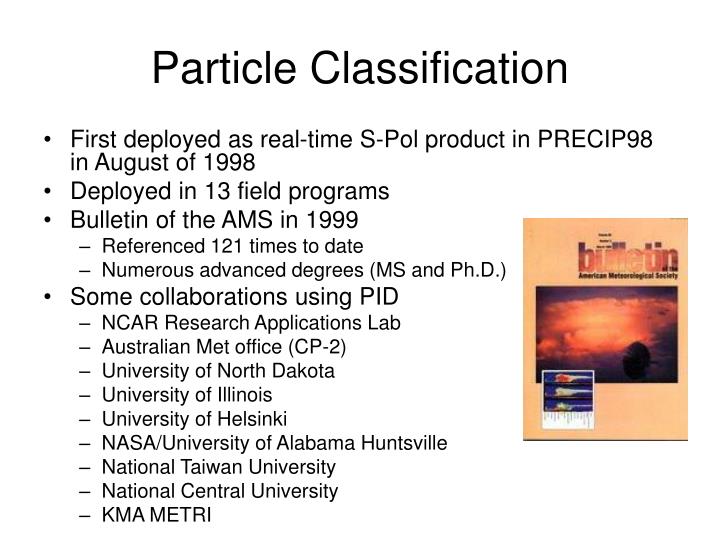
Particle Classification. First deployed as real-time S-Pol product in PRECIP98 in August of 1998 Deployed in 13 field programs Bulletin of the AMS in 1999 Referenced 121 times to date Numerous advanced degrees (MS and Ph.D.) Some collaborations using PID NCAR Research Applications Lab

E N D
Particle Classification • First deployed as real-time S-Pol product in PRECIP98 in August of 1998 • Deployed in 13 field programs • Bulletin of the AMS in 1999 • Referenced 121 times to date • Numerous advanced degrees (MS and Ph.D.) • Some collaborations using PID • NCAR Research Applications Lab • Australian Met office (CP-2) • University of North Dakota • University of Illinois • University of Helsinki • NASA/University of Alabama Huntsville • National Taiwan University • National Central University • KMA METRI
Deierling W, Petersen WA, Latham J, Ellis S., and Christian H, 2008: The relationship between lightning activity and ice fluxes in thunderstorms. Stoelinga, M. T., P. V. Hobbs, C. V. Mass, J. D. Locatelli, B. A. Colle, R. A. Houze, A. L. Rangno, N. A. Bond, B. F. Smull, R. M. Rasmussen, G. Thompson, and B. R. Colman, 2003: Improvement of Microphysical Parameterization through Observational Verification Experiment (IMPROVE). Research Highlights Barthezy, Eszter, S. Goeke, J Vivekanandan and S. M. Ellis 2001: Detection of snow and ice crystals using polarization radar measurements: comparison between ground-based in situ and S-Pol observations.
Heavy rain or hail? Polarimetric Measurements Add information about the shape and size of hydrometeors over Reflectivity Range Height Indicator (RHI) of Reflectivity: S-Pol Idalia CO, 2000 Where is the mixed phase?
Polarimetric Measurements • Differential reflectivity (ZDR) • Ratio of H and V (linear) • Z-weighted axis ratio • For drops ZDR ~ drop size • Z-ZDR distinguishes liquid from some ice particles • Oriented ice crystals • Graupel/hail • Melting snow • Ice and liquid signatures can be ambiguous From Pruppacher and Klett 1997
Polarimetric Measurements RHI with Z and ZDR Data Reflectivity (dBZ) Differential Refl. (dB) High Z + Low ZDR = Hail
Polarimetric Measurements • Correlation coefficient (rHV) • Correlation between horizontal and vertical polarizations within each range gate • Large, irregular hail • Wet particles • Mixed phase conditions From Pruppacher and Klett 1997
Polarimetric Measurements • Specific differential phase (KDP) • Difference in phase shift of horizontal and vertical beams per km • Sensitive to liquid water • Small KDP for highly oriented crystals From Pruppacher and Klett 1997
Polarimetric Measurements • Linear Depolarization Ratio (LDR) • 10log10(ZHV/ZHH) • Wet particles • Mixed phase conditions
High ZDR + Low rHV = Mixed phase RHI with Polarimetric Data
Fuzzy Logic Particle Classification • Identify most likely dominant scatterer • Fuzzy logic technique used • Emulates radar expert interpretation • Combines various polarimetric inputs • No “hard” boundaries • Logic and fuzzy rules similar to expert reasoning
RHI with Particle ID Particle ID output Differential Refl. (dB) Reflectivity (dBZ) Dry snow Graupel Hail Rain Hail Detection Ratio (HDR) rHV KDP (deg/km)
Melting Hail Melting Graupel RHI with Particle ID Particle ID output Differential Refl. (dB) Reflectivity (dBZ) Dry snow Rain Hail Detection Ratio (HDR) rHV KDP (deg/km)
P = interest value Q = weighted sum for each particle classification Apply thresholds Fuzzy Logic Particle Classification Reflectivity 1 rain hail 0 35 50 55 65 ZDR 1 Membership functions 0 -1 0 1 2 LDR 1 Example of classifier for rain and hail 0 -30 -27 -24 -15
2-D Membership Functions: ZDR From Pruppacher and Klett 1997
Sources of Membership Functions and Thresholds • Theory • Extensive literature search • T-Matrix model computations • Observations • Literature • Aircraft observations (limited) • S-Pol and CHILL data sets • Experience • Numerous field campaigns in different climate regions • Real time evaluation • Post analysis • Input from users
Issues • Overlapping polarimetric signatures • SLD and ice - may need additional observations, e.g. GOES • Melting snow and melting graupel • Snow and graupel • Pristine crystals and small aggregates • When is the graupel/hail completely melted???? • Bragg scatter and drizzle/cloud • Accurate temperature profiles • Ambiguous microphysical definitions • How much riming turns snow to graupel? • Radar data quality and artifacts: • Side lobes • Radar calibration • Partial beam blockage • Partial beam illumination • New weather situation – • At TIMREX we observed larger drops than ever before – misclassified as melting graupel/hail
Fuzzy Logic Particle Classification • Runs in real-time • Operates in radar coordinates • Utilizes sounding temperature data • Currently operates on single range-gate
Benefits of Hydrometeor ID • Improved data quality • Ground clutter detection • Insect clear air detection • Bright band detection • Improved rain rate estimation • Snow/rain boundary detection • Eases interpreting complicated polarimetric data • Hazard detection • Scientific analysis
Melting graupel Thunderstorm: S-Pol PPI at 1.3 deg elevation STEPS, Idalia CO, 2000 Rain Hail Particle ID output Differential Refl. (dB) Reflectivity (dBZ) Hail Detection Ratio (HDR) rHV KDP (deg/km)
Thunderstorm: S-Pol PPI at 2.1 deg elevation STEPS, Idalia CO, 2000 graupel Rain Hail Particle ID output Differential Refl. (dB) Reflectivity (dBZ) Hail Detection Ratio (HDR) rHV KDP (deg/km)
Ice Crystals 1 hour total lightning Graupel Dry Snow Wet Snow Mod rain Heavy Rain Thunderstorm: S-Pol RHI Over TIMREX Super Site, S. Taiwan 16 km
Severe Hail Storm STEPS RHI: June 29, 23:37:04 14 Z 10 6 2 70 90 50 14 ZDR 10 6 2 70 50 90 14 Particle ID 10 6 2 70 90 50
Bright-band Example Reflectivity (dBZ) Particle ID output Dry snow snow Rain Wet Differential Refl. (dB) rHV Melting layer MAP, Italy 1999
Mixed Clutter and Clear Air Example Reflectivity (dBZ) Particle ID output Ground clutter Differential Refl. (dB) VR(ms-1) STEPS, Colorado 2000
Mixed Clutter and Clear Air Example Reflectivity (dBZ) Particle ID output Insects Differential Refl. (dB) VR(ms-1) STEPS, Colorado 2000
Mixed Clutter and Clear Air Example Reflectivity (dBZ) Particle ID output Rain Differential Refl. (dB) VR(ms-1) STEPS, Colorado 2000
~ Aircraft location Aircraft comparison: MAP, Italy 1999 Z LDR 20 40 ~ 4.6 mm RICE – no icing occurred PMS – crystals and aggregates Radar – dry snow Particle classification ZDR snow Wet Rain Dry snow Irregular ice Oriented ice
Comparison of PID to PMS-2DC microphysics data Irregular ice Dry snow PID using CSU CHILL S-band radar data • PMS 2DC agrees well with the PID output
Classification examples with different data quality issues • Radar data quality issues • Temperature profile errors
Radar data Quality – CSU CHILL 1996 Positive ZDR Z PID ZDR LDR KDP rHV PPI at 4.0o elevation
Radar data Quality – CSU CHILL 1996 ZDR unreliable, other polarimetric variables consistent, PID robust Negative ZDR Z PID ZDR LDR KDP rHV PPI at 4.0o elevation 6 minutes later
Radar data Quality – CSU CHILL 1996 Z PID ZDR LDR KDP rHV PPI at 1.5o elevation
Radar data Quality – CSU CHILL 1996 ZDR unreliable, other polarimetric variables consistent, PID not as robust ZDR Biased Positive Z PID ZDR LDR KDP rHV PPI at 1.5o elevation 6 minutes later
Temperature Profile Errors High ZDR ,Kdp, LDR combined with low rHV and enhanced Z, strong indication of bright band, but 0oC level is erroneously high Z ZDR PID Dry snow Wet snow Rain LDR KDP rHV
Other Algorithms for Particle ID • Hard boundaries • Not as robust to realities of data as fuzzy logic • Susceptible to unclassifiable data combination • Drawback or strength?? • Neuro-fuzzy system (combination of neural network and fuzzy logic) • Neural networks utilized to set and adjust the membership functions of the fuzzy logic algorithm. • The performance of a fuzzy logic classifier depends critically on the membership functions. A neuro-fuzzy system learns from data and can adjust the membership functions. • Neural networks generally require a large, high quality “truth” set to work well • Neural networks work from statistics while fuzzy logic works from knowledge of the physics of the problem – Choose wisely!
Future Work and Improvements • Automatically adjust 0o C level using robust melting level detection • Incorporate wet bulb temperature • Identify sea clutter • Compute confidence field • Collaboration with U. Illinois • Collaboration with RAL • Spatial continuity • Optimization of membership functions and weights using method of G. Lee • Quantitatively define the rain categories • Modify algorithm for X-band measurements