Download
1 / 1
10 likes | 26 Views
Axis Direct presents daily derivatives report presenting recommendations based on technical analysis. For trading in derivatives visit https://simplehai.axisdirect.in/offerings/products/derivatives<br>https://simplehai.axisdirect.in/share-stock-prices/nse/Housing-Development-Finance-Corporation-Ltd-230<br>https://simplehai.axisdirect.in/share-stock-prices/nse/ITC-Ltd-301<br>https://simplehai.axisdirect.in/share-stock-prices/nse/Jet-Airways-(India)-Ltd-5586<br>

E N D
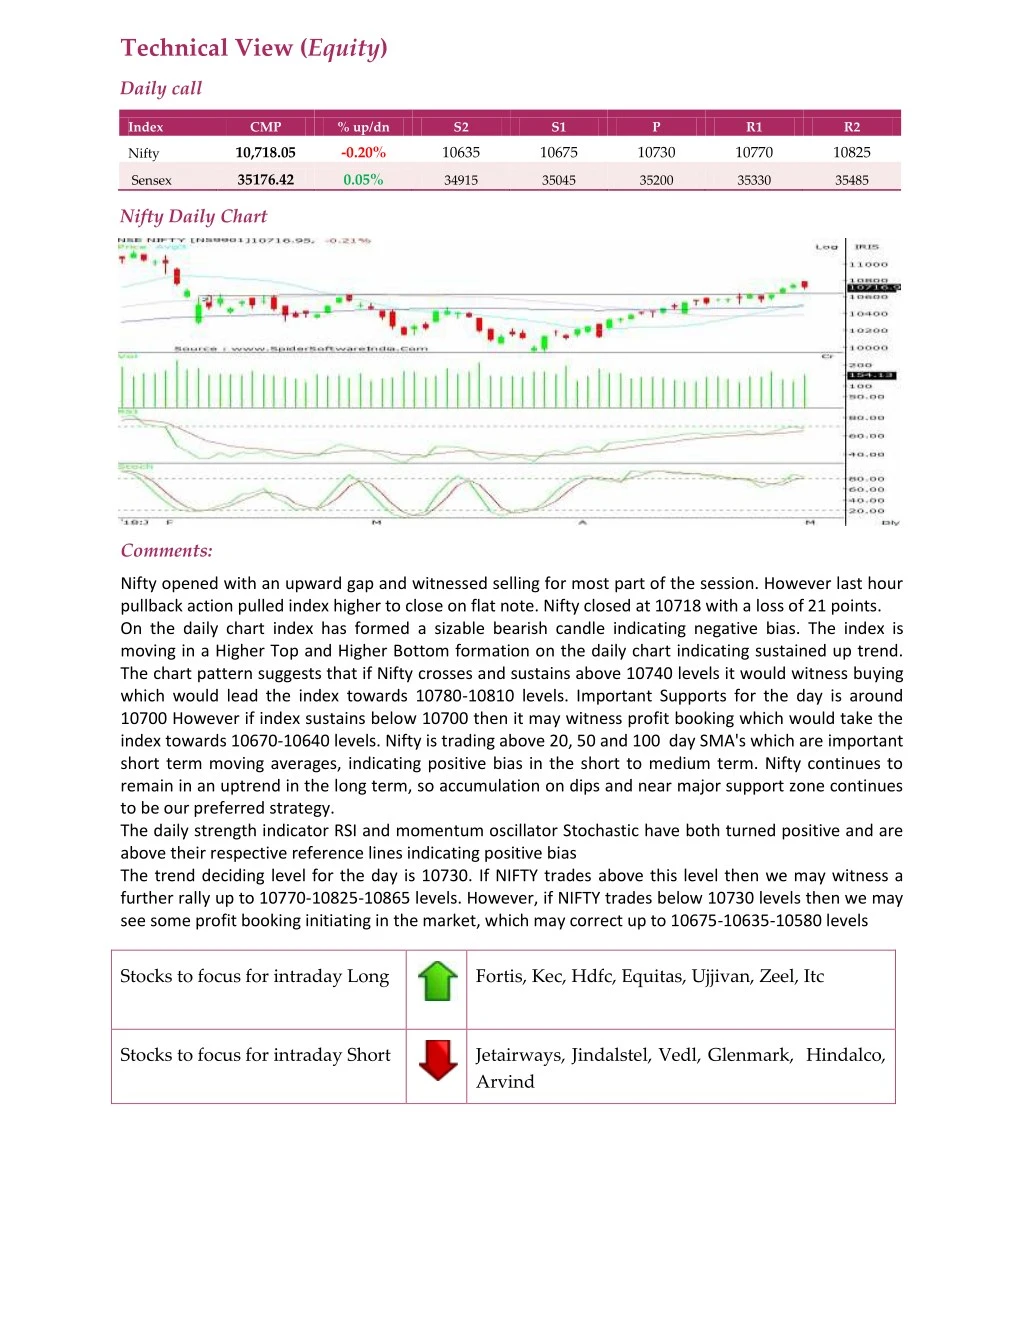
Technical View (Equity) Daily call Index CMP % up/dn S2 S1 P R1 R2 10,718.05 -0.20% 10635 10675 10730 10770 10825 Nifty 35176.42 0.05% Sensex 34915 35045 35200 35330 35485 Nifty Daily Chart Comments: Nifty opened with an upward gap and witnessed selling for most part of the session. However last hour pullback action pulled index higher to close on flat note. Nifty closed at 10718 with a loss of 21 points. On the daily chart index has formed a sizable bearish candle indicating negative bias. The index is moving in a Higher Top and Higher Bottom formation on the daily chart indicating sustained up trend. The chart pattern suggests that if Nifty crosses and sustains above 10740 levels it would witness buying which would lead the index towards 10780-10810 levels. Important Supports for the day is around 10700 However if index sustains below 10700 then it may witness profit booking which would take the index towards 10670-10640 levels. Nifty is trading above 20, 50 and 100 day SMA's which are important short term moving averages, indicating positive bias in the short to medium term. Nifty continues to remain in an uptrend in the long term, so accumulation on dips and near major support zone continues to be our preferred strategy. The daily strength indicator RSI and momentum oscillator Stochastic have both turned positive and are above their respective reference lines indicating positive bias The trend deciding level for the day is 10730. If NIFTY trades above this level then we may witness a further rally up to 10770-10825-10865 levels. However, if NIFTY trades below 10730 levels then we may see some profit booking initiating in the market, which may correct up to 10675-10635-10580 levels Stocks to focus for intraday Long Fortis, Kec, Hdfc, Equitas, Ujjivan, Zeel, Itc Stocks to focus for intraday Short Jetairways, Jindalstel, Vedl, Glenmark, Hindalco, Arvind