Download
1 / 1
10 likes | 15 Views
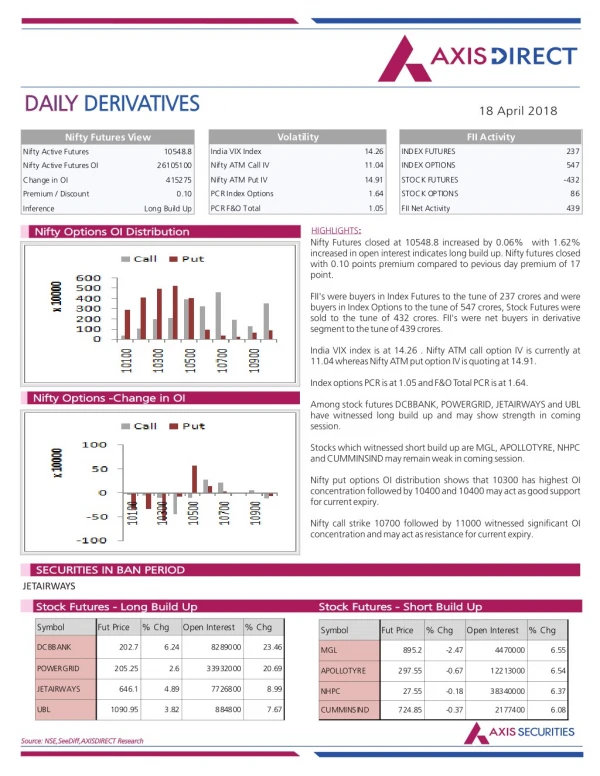
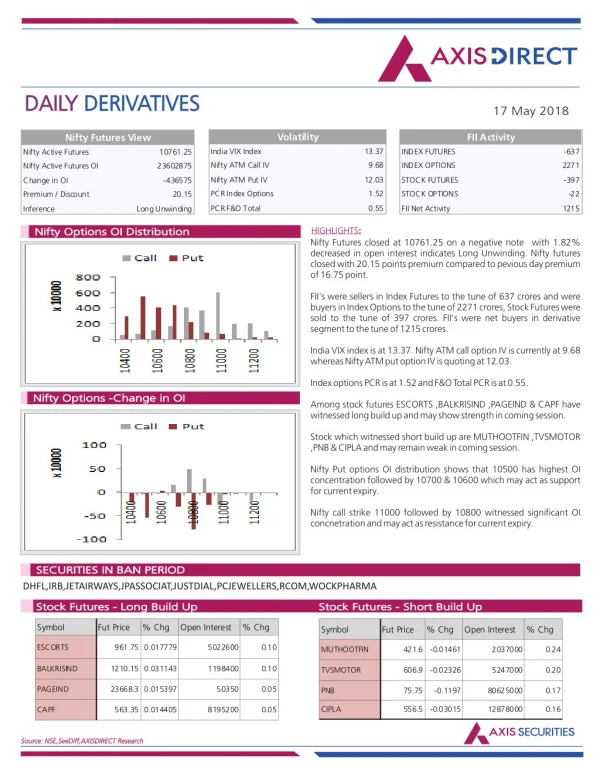
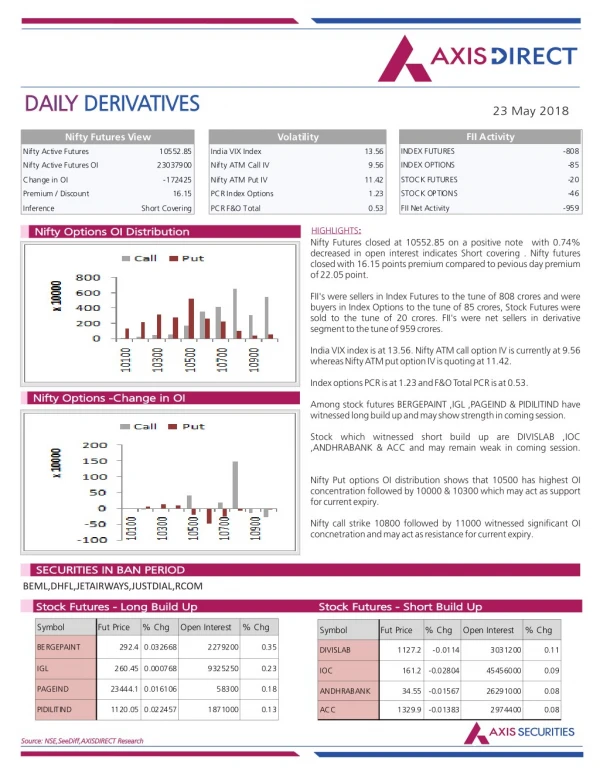
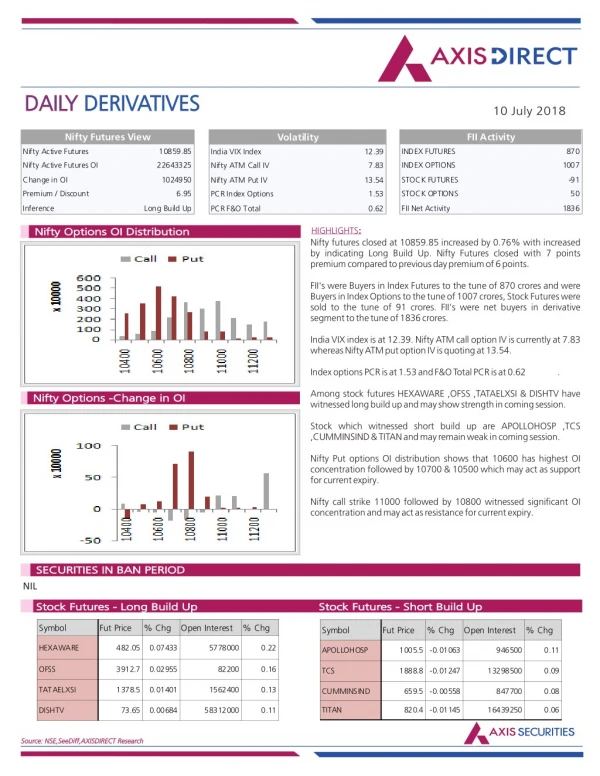
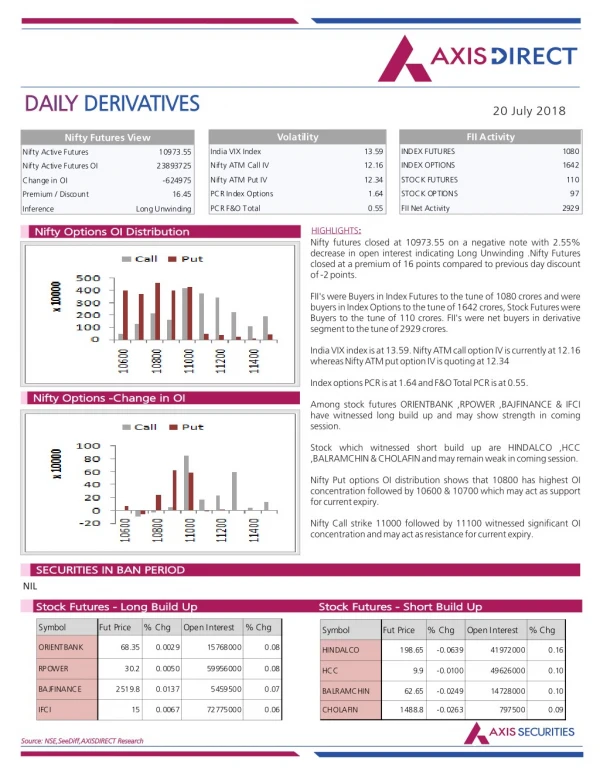
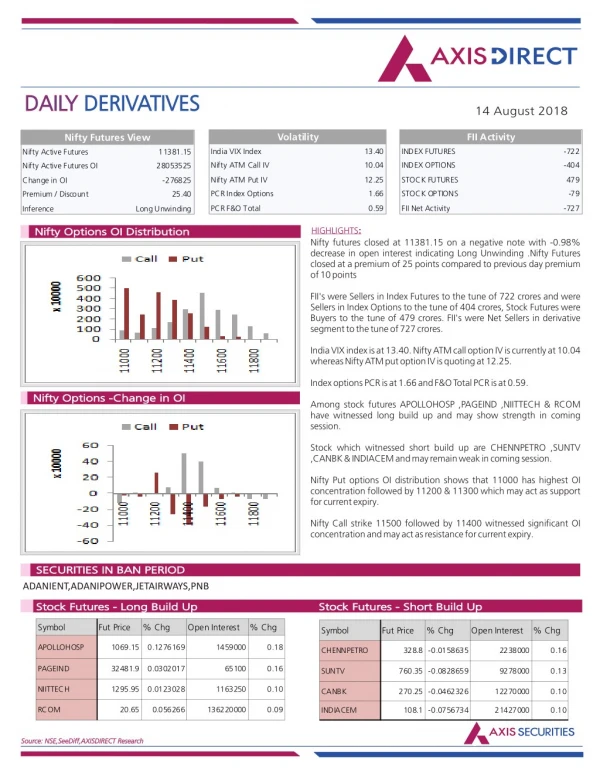
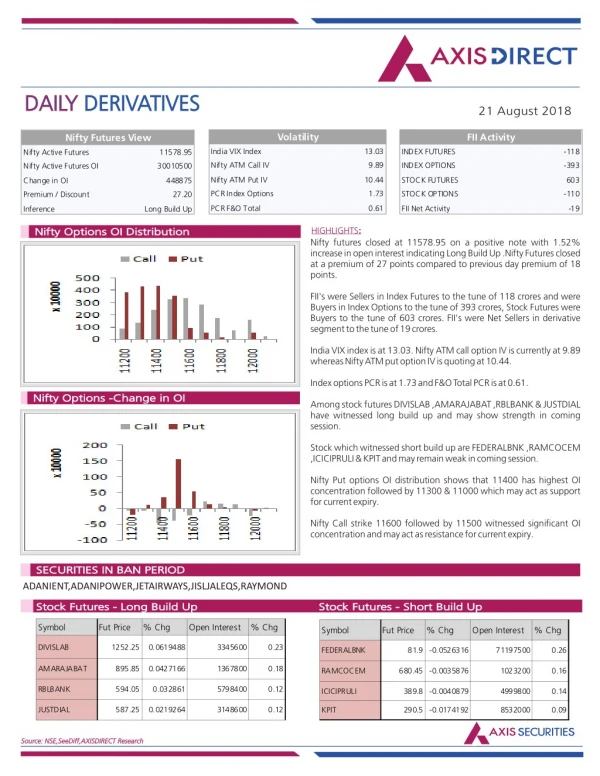
Axis Direct presents daily derivatives report presenting recommendations based on technical analysis. For trading in derivatives visit https://simplehai.axisdirect.in/offerings/products/derivatives<br>https://simplehai.axisdirect.in/share-stock-prices/nse/ICICI-Bank-Ltd-5418<br>https://simplehai.axisdirect.in/share-stock-prices/nse/Tata-Steel-Ltd-566<br>https://simplehai.axisdirect.in/share-stock-prices/nse/Tata-Motors-Ltd-560<br>

E N D
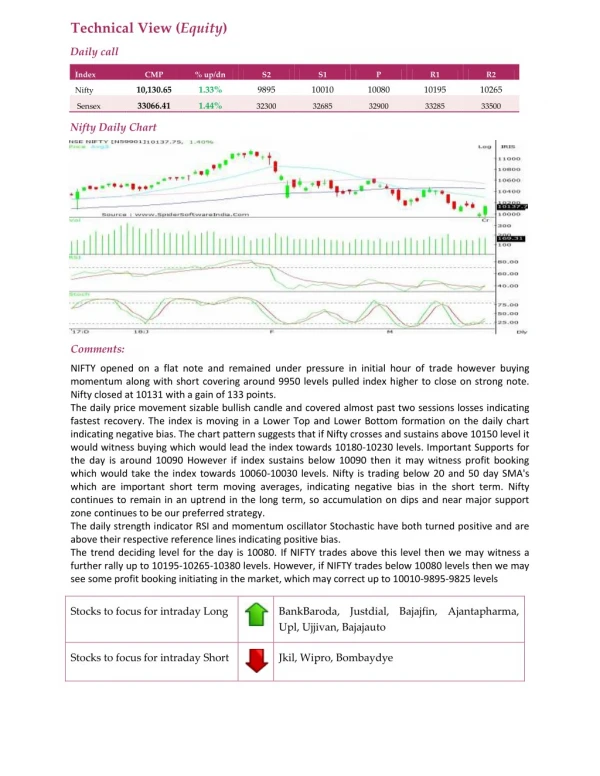
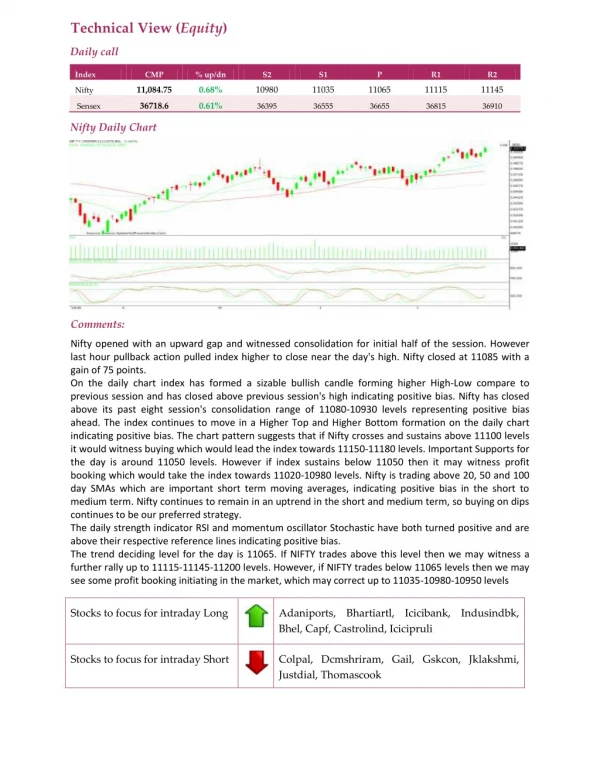
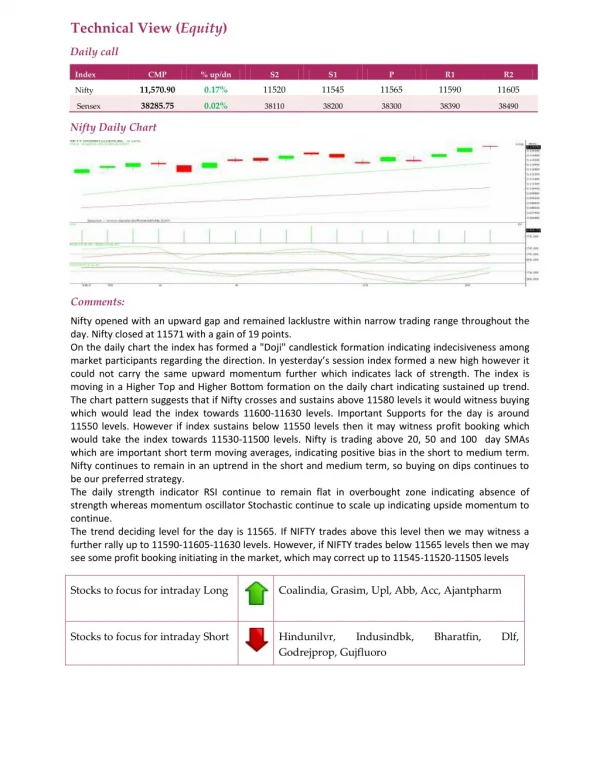
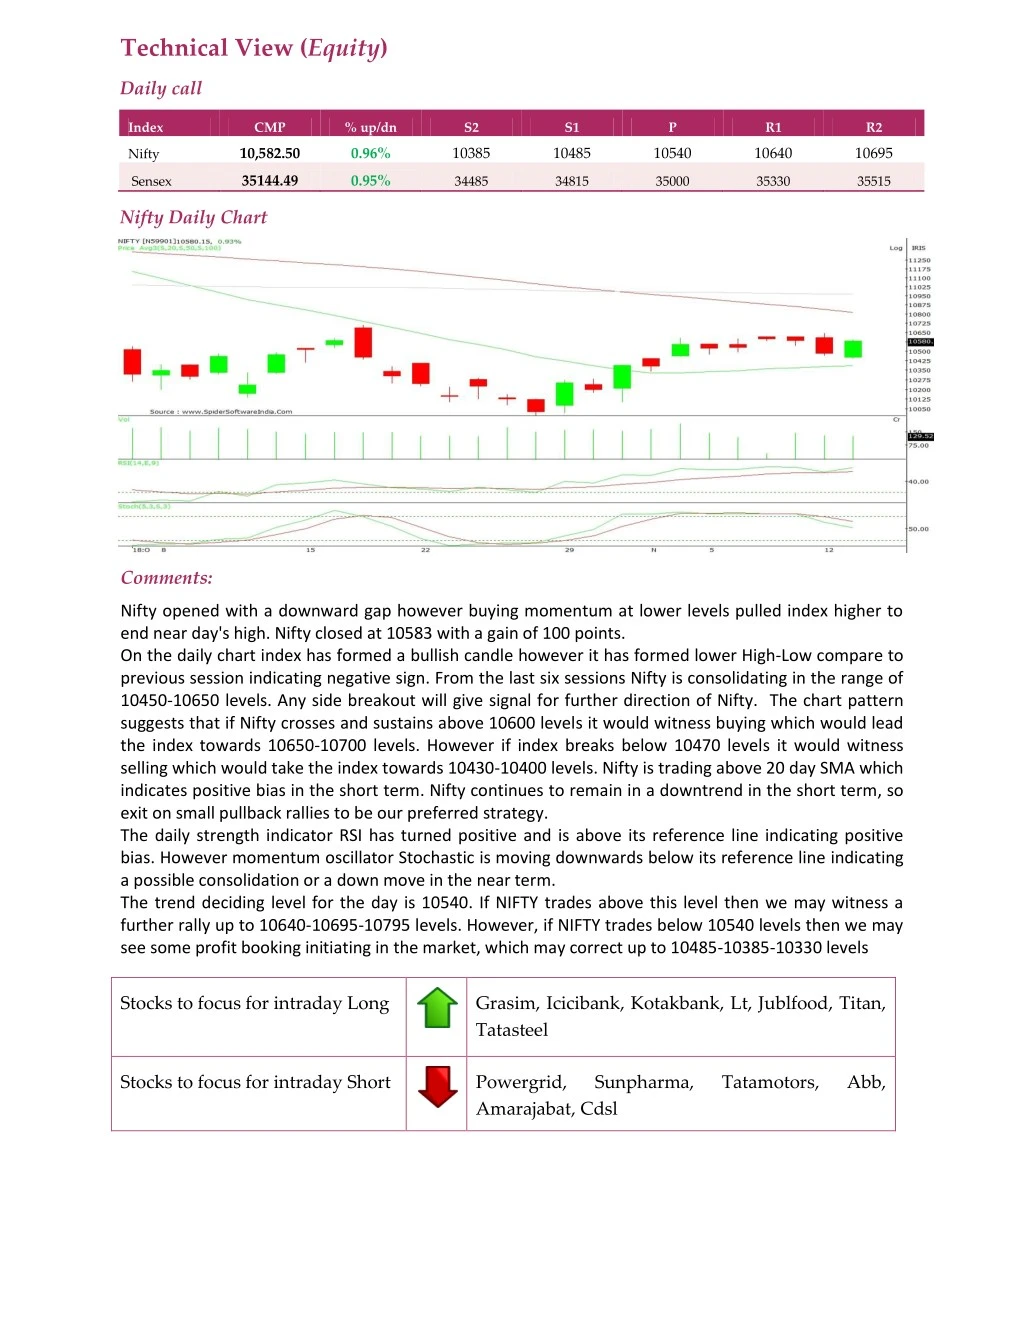
Technical View (Equity) Daily call Index CMP % up/dn S2 S1 P R1 R2 10,582.50 0.96% 10385 10485 10540 10640 10695 Nifty 35144.49 0.95% Sensex 34485 34815 35000 35330 35515 Nifty Daily Chart Comments: Nifty opened with a downward gap however buying momentum at lower levels pulled index higher to end near day's high. Nifty closed at 10583 with a gain of 100 points. On the daily chart index has formed a bullish candle however it has formed lower High-Low compare to previous session indicating negative sign. From the last six sessions Nifty is consolidating in the range of 10450-10650 levels. Any side breakout will give signal for further direction of Nifty. The chart pattern suggests that if Nifty crosses and sustains above 10600 levels it would witness buying which would lead the index towards 10650-10700 levels. However if index breaks below 10470 levels it would witness selling which would take the index towards 10430-10400 levels. Nifty is trading above 20 day SMA which indicates positive bias in the short term. Nifty continues to remain in a downtrend in the short term, so exit on small pullback rallies to be our preferred strategy. The daily strength indicator RSI has turned positive and is above its reference line indicating positive bias. However momentum oscillator Stochastic is moving downwards below its reference line indicating a possible consolidation or a down move in the near term. The trend deciding level for the day is 10540. If NIFTY trades above this level then we may witness a further rally up to 10640-10695-10795 levels. However, if NIFTY trades below 10540 levels then we may see some profit booking initiating in the market, which may correct up to 10485-10385-10330 levels Stocks to focus for intraday Long Grasim, Icicibank, Kotakbank, Lt, Jublfood, Titan, Tatasteel Stocks to focus for intraday Short Powergrid, Amarajabat, Cdsl Sunpharma, Tatamotors, Abb,