Download
1 / 1
10 likes | 22 Views
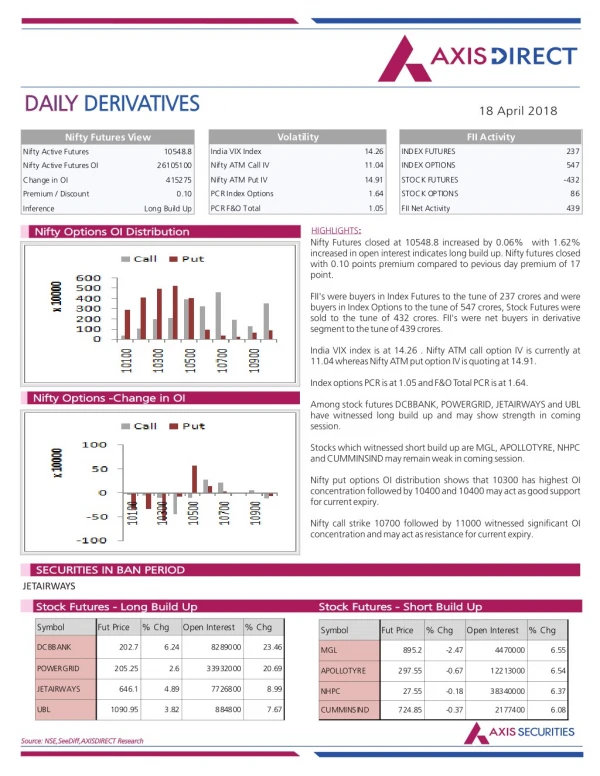
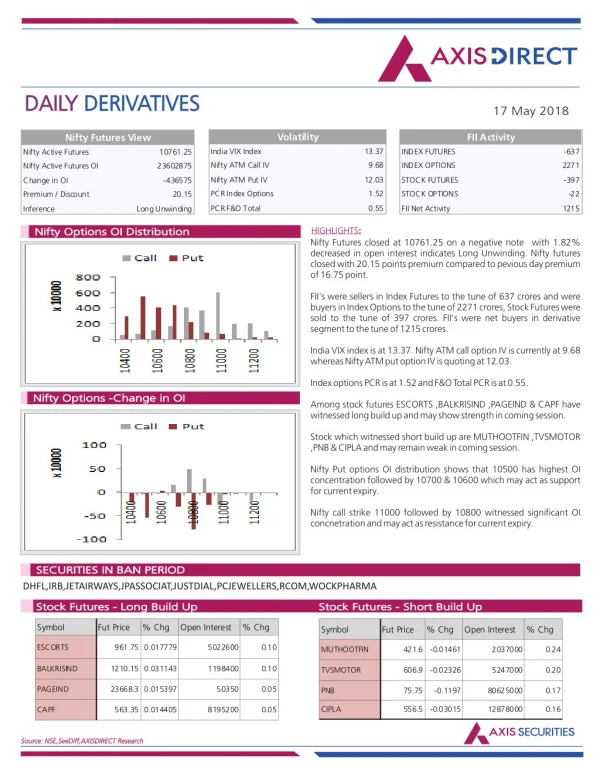
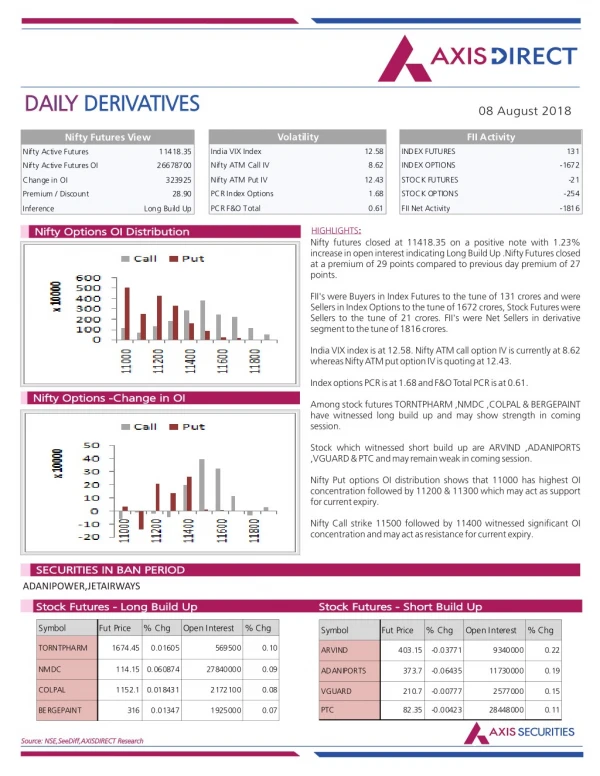
Axis Direct presents daily derivatives report presenting recommendations based on technical analysis. For trading in derivatives visit https://simplehai.axisdirect.in/offerings/products/derivatives<br>https://simplehai.axisdirect.in/share-stock-prices/nse/Reliance-Industries-Ltd-476<br>https://simplehai.axisdirect.in/share-stock-prices/nse/Sun-Pharmaceuticals-Industries-Ltd-4325<br><br>

E N D
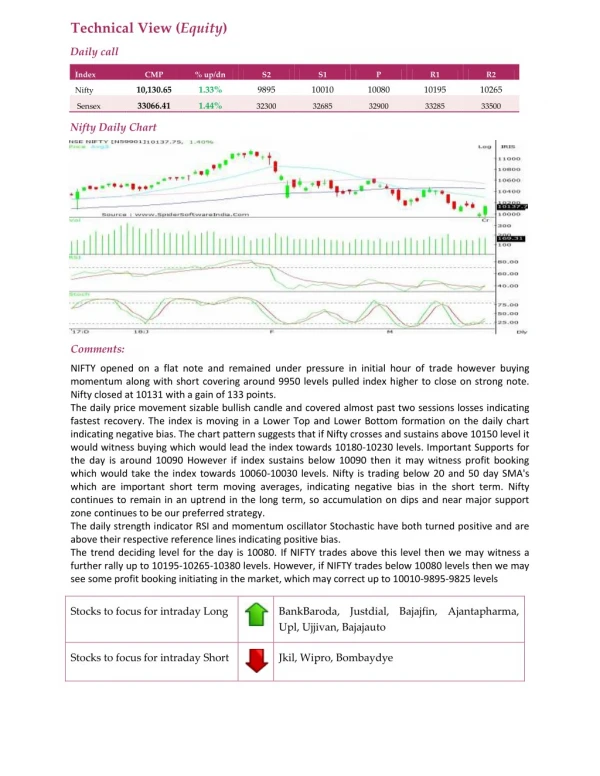
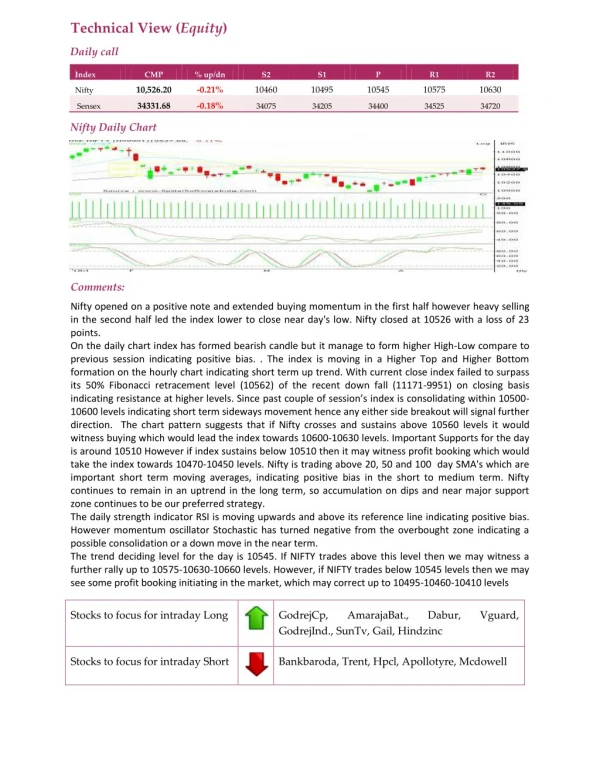
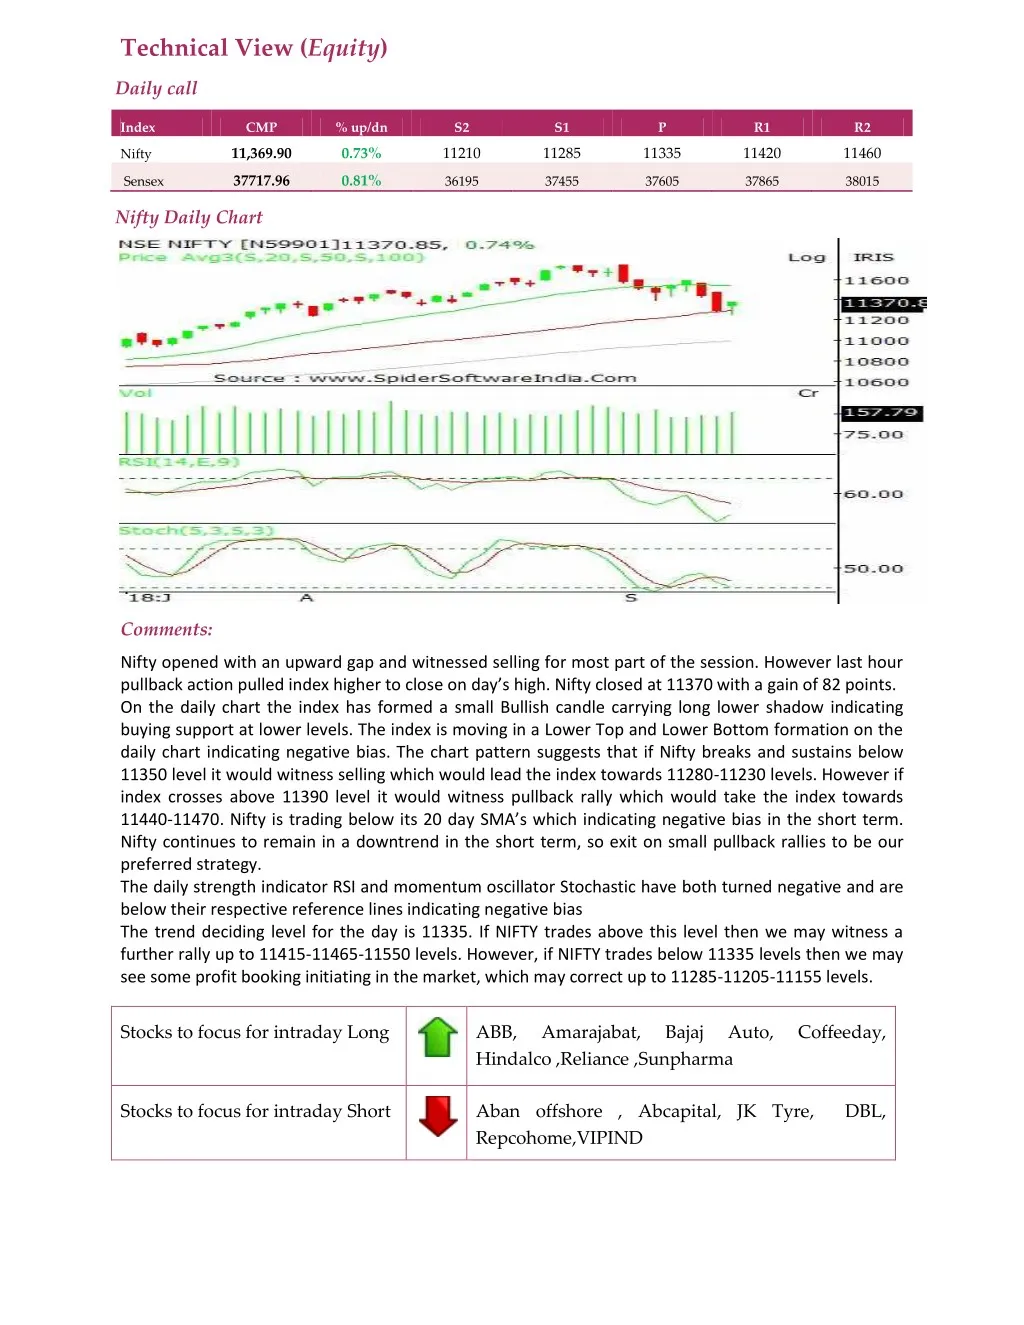
Technical View (Equity) Daily call Index CMP % up/dn S2 S1 P R1 R2 11,369.90 0.73% 11210 11285 11335 11420 11460 Nifty 37717.96 0.81% Sensex 36195 37455 37605 37865 38015 Nifty Daily Chart Comments: Nifty opened with an upward gap and witnessed selling for most part of the session. However last hour pullback action pulled index higher to close on day’s high. Nifty closed at 11370 with a gain of 82 points. On the daily chart the index has formed a small Bullish candle carrying long lower shadow indicating buying support at lower levels. The index is moving in a Lower Top and Lower Bottom formation on the daily chart indicating negative bias. The chart pattern suggests that if Nifty breaks and sustains below 11350 level it would witness selling which would lead the index towards 11280-11230 levels. However if index crosses above 11390 level it would witness pullback rally which would take the index towards 11440-11470. Nifty is trading below its 20 day SMA’s which indicating negative bias in the short term. Nifty continues to remain in a downtrend in the short term, so exit on small pullback rallies to be our preferred strategy. The daily strength indicator RSI and momentum oscillator Stochastic have both turned negative and are below their respective reference lines indicating negative bias The trend deciding level for the day is 11335. If NIFTY trades above this level then we may witness a further rally up to 11415-11465-11550 levels. However, if NIFTY trades below 11335 levels then we may see some profit booking initiating in the market, which may correct up to 11285-11205-11155 levels. Stocks to focus for intraday Long ABB, Hindalco ,Reliance ,Sunpharma Amarajabat, Bajaj Auto, Coffeeday, Stocks to focus for intraday Short Aban offshore , Abcapital, JK Tyre, DBL, Repcohome,VIPIND