Download
1 / 1
10 likes | 28 Views
Axis Direct presents daily derivatives report presenting recommendations based on technical analysis. For trading in derivatives visit https://simplehai.axisdirect.in/offerings/products/derivatives<br>

E N D
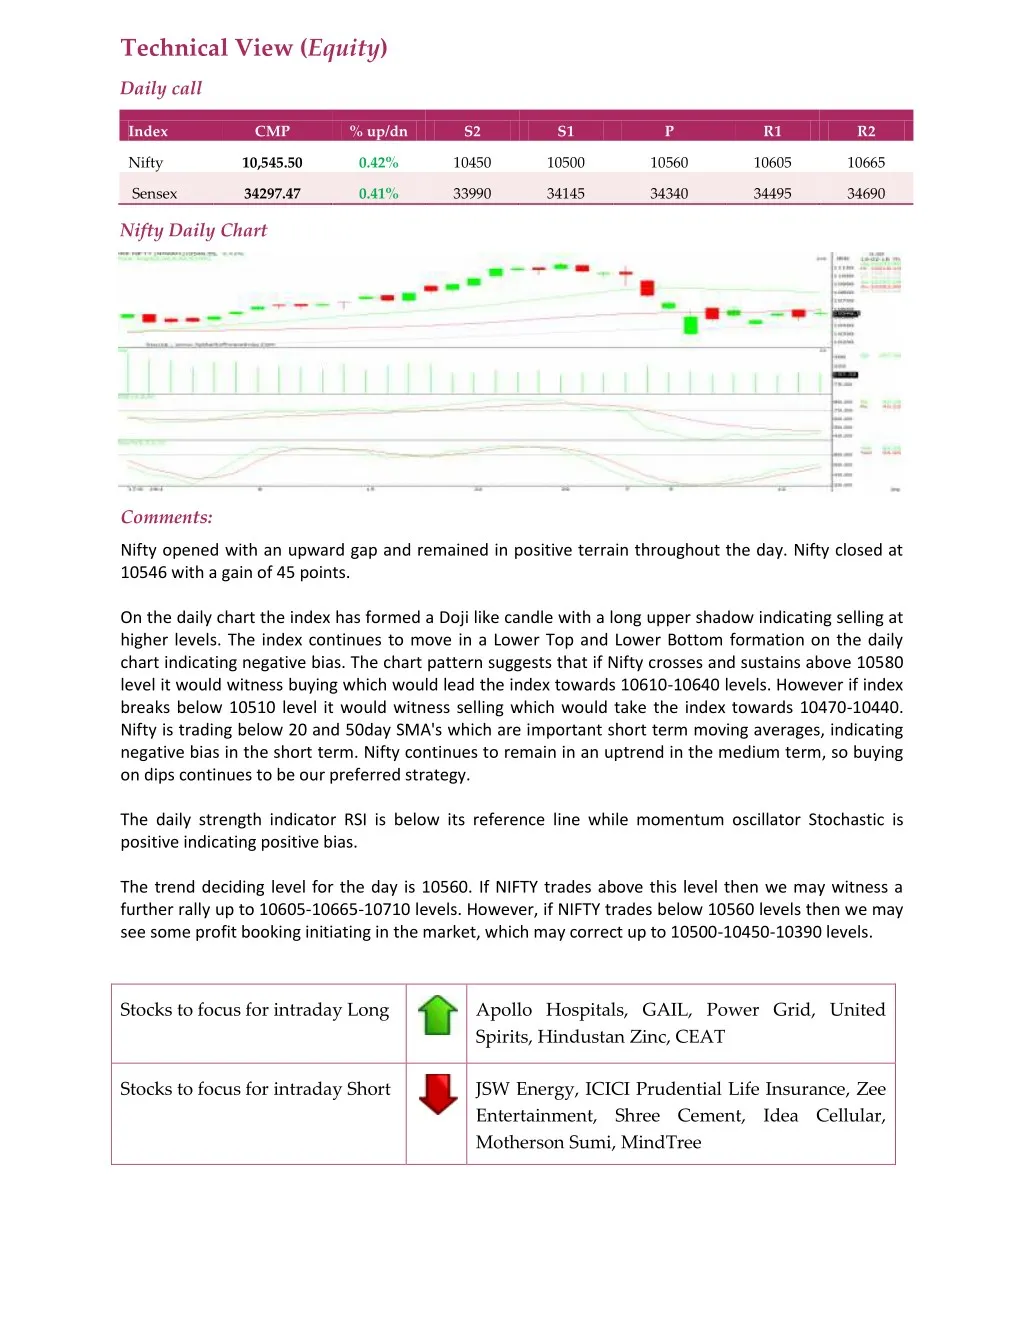
Technical View (Equity) Daily call Index CMP % up/dn S2 S1 P R1 R2 Nifty 10,545.50 0.42% 10450 10500 10560 10605 10665 Sensex 34297.47 0.41% 33990 34145 34340 34495 34690 Nifty Daily Chart Comments: Nifty opened with an upward gap and remained in positive terrain throughout the day. Nifty closed at 10546 with a gain of 45 points. On the daily chart the index has formed a Doji like candle with a long upper shadow indicating selling at higher levels. The index continues to move in a Lower Top and Lower Bottom formation on the daily chart indicating negative bias. The chart pattern suggests that if Nifty crosses and sustains above 10580 level it would witness buying which would lead the index towards 10610-10640 levels. However if index breaks below 10510 level it would witness selling which would take the index towards 10470-10440. Nifty is trading below 20 and 50day SMA's which are important short term moving averages, indicating negative bias in the short term. Nifty continues to remain in an uptrend in the medium term, so buying on dips continues to be our preferred strategy. The daily strength indicator RSI is below its reference line while momentum oscillator Stochastic is positive indicating positive bias. The trend deciding level for the day is 10560. If NIFTY trades above this level then we may witness a further rally up to 10605-10665-10710 levels. However, if NIFTY trades below 10560 levels then we may see some profit booking initiating in the market, which may correct up to 10500-10450-10390 levels. Stocks to focus for intraday Long Apollo Hospitals, GAIL, Power Grid, United Spirits, Hindustan Zinc, CEAT Stocks to focus for intraday Short JSW Energy, ICICI Prudential Life Insurance, Zee Entertainment, Shree Cement, Idea Cellular, Motherson Sumi, MindTree