Download
1 / 1
10 likes | 16 Views
Axis Direct presents daily derivatives report presenting recommendations based on technical analysis. For trading in derivatives visit https://simplehai.axisdirect.in/offerings/products/derivatives<br>https://simplehai.axisdirect.in/share-stock-prices/nse/Cipla-Ltd-114<br>https://simplehai.axisdirect.in/share-stock-prices/nse/ICICI-Bank-Ltd-5418<br>https://simplehai.axisdirect.in/share-stock-prices/nse/HDFC-Bank-Ltd-4987<br>

E N D
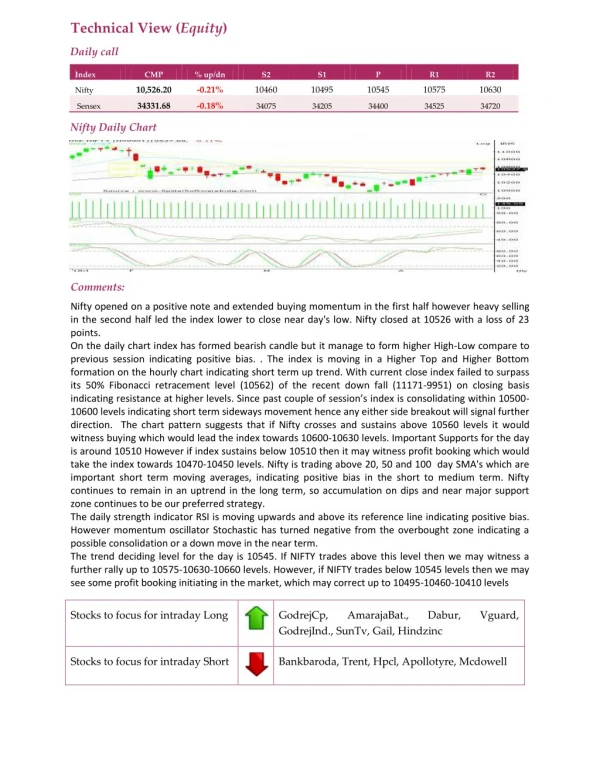
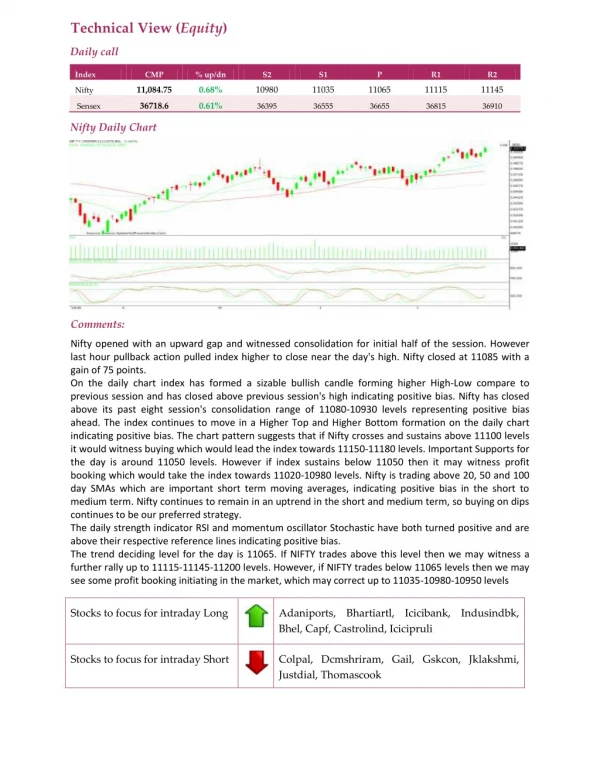
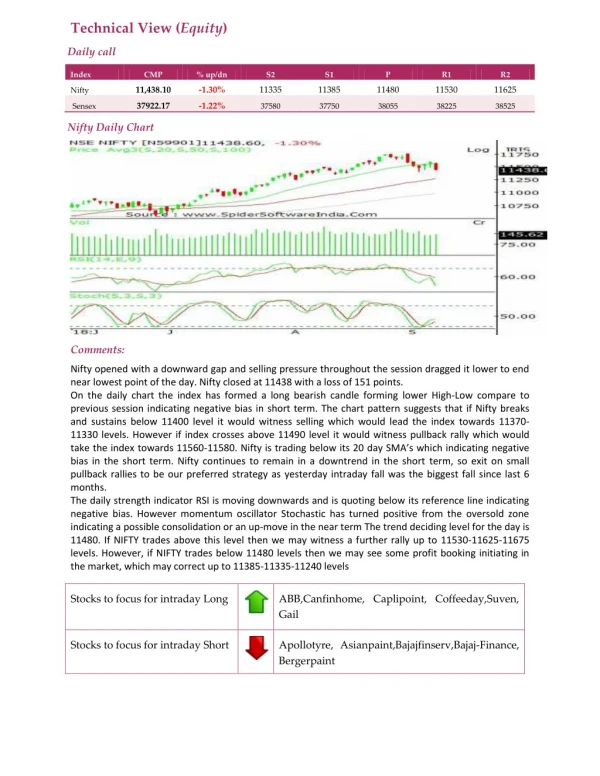
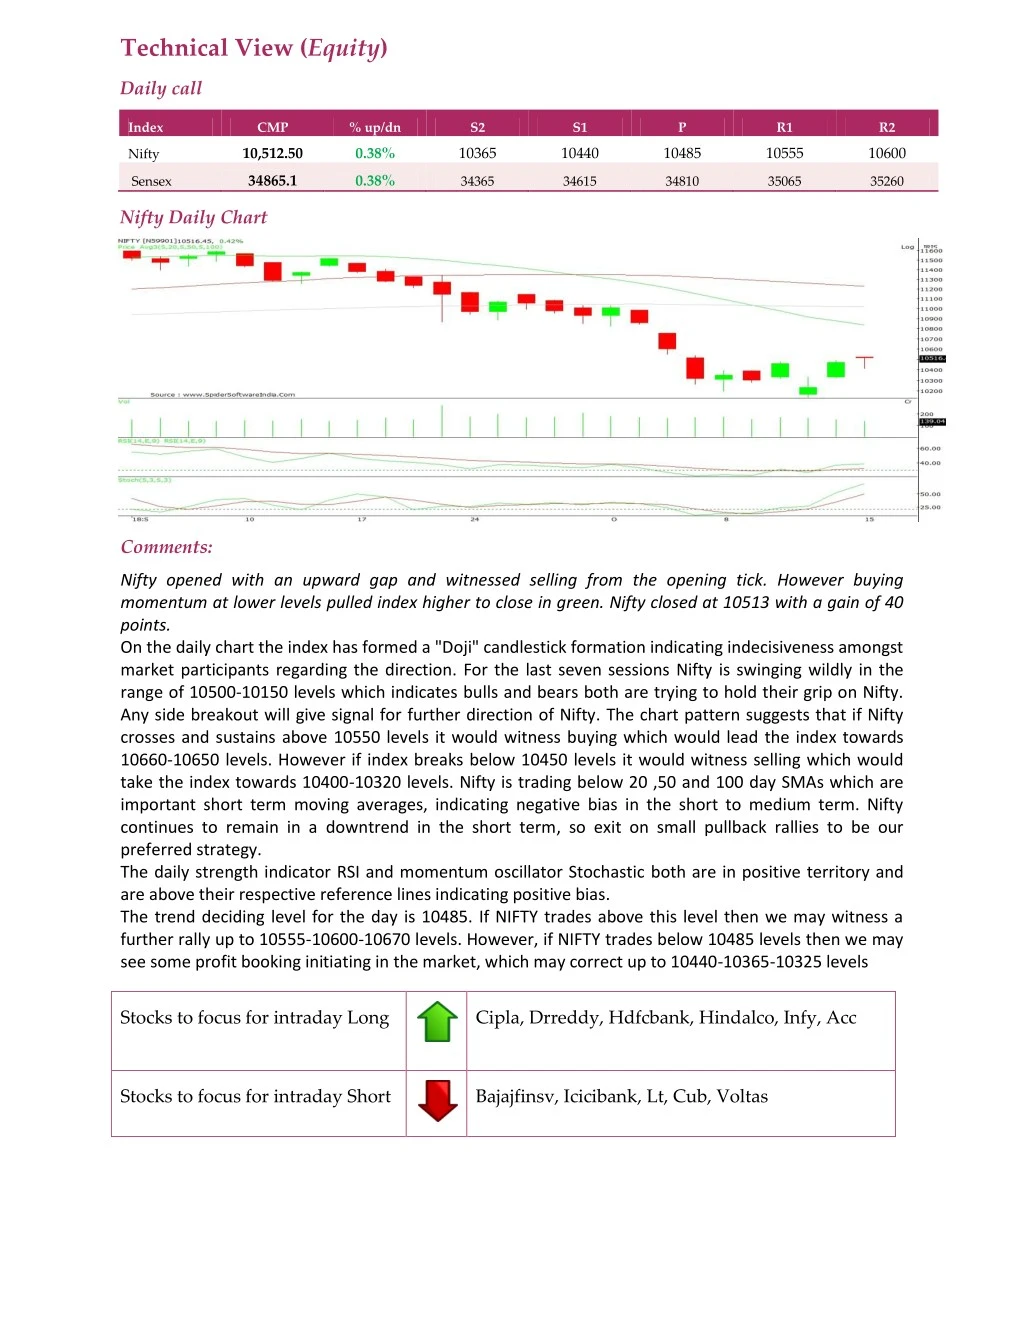
Technical View (Equity) Daily call Index CMP % up/dn S2 S1 P R1 R2 10,512.50 0.38% 10365 10440 10485 10555 10600 Nifty 34865.1 0.38% Sensex 34365 34615 34810 35065 35260 Nifty Daily Chart Comments: Nifty opened with an upward gap and witnessed selling from the opening tick. However buying momentum at lower levels pulled index higher to close in green. Nifty closed at 10513 with a gain of 40 points. On the daily chart the index has formed a "Doji" candlestick formation indicating indecisiveness amongst market participants regarding the direction. For the last seven sessions Nifty is swinging wildly in the range of 10500-10150 levels which indicates bulls and bears both are trying to hold their grip on Nifty. Any side breakout will give signal for further direction of Nifty. The chart pattern suggests that if Nifty crosses and sustains above 10550 levels it would witness buying which would lead the index towards 10660-10650 levels. However if index breaks below 10450 levels it would witness selling which would take the index towards 10400-10320 levels. Nifty is trading below 20 ,50 and 100 day SMAs which are important short term moving averages, indicating negative bias in the short to medium term. Nifty continues to remain in a downtrend in the short term, so exit on small pullback rallies to be our preferred strategy. The daily strength indicator RSI and momentum oscillator Stochastic both are in positive territory and are above their respective reference lines indicating positive bias. The trend deciding level for the day is 10485. If NIFTY trades above this level then we may witness a further rally up to 10555-10600-10670 levels. However, if NIFTY trades below 10485 levels then we may see some profit booking initiating in the market, which may correct up to 10440-10365-10325 levels Stocks to focus for intraday Long Cipla, Drreddy, Hdfcbank, Hindalco, Infy, Acc Stocks to focus for intraday Short Bajajfinsv, Icicibank, Lt, Cub, Voltas