Download
1 / 1
10 likes | 16 Views
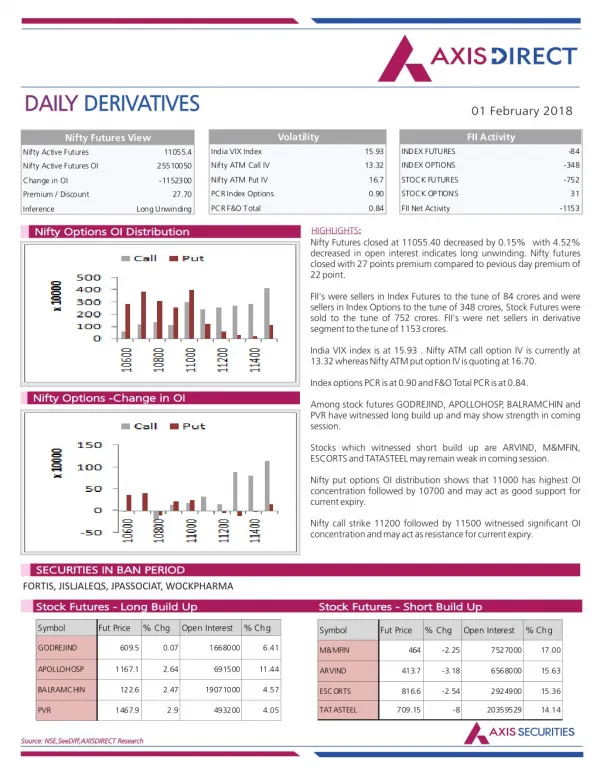
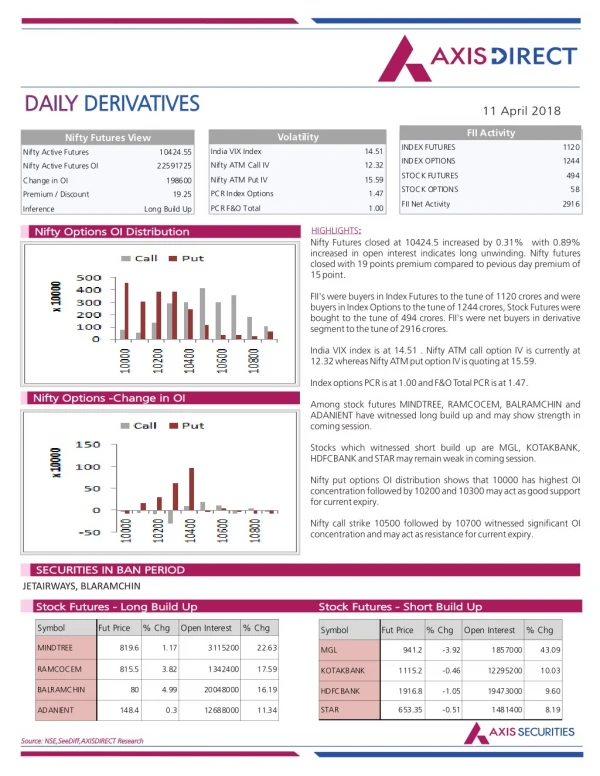
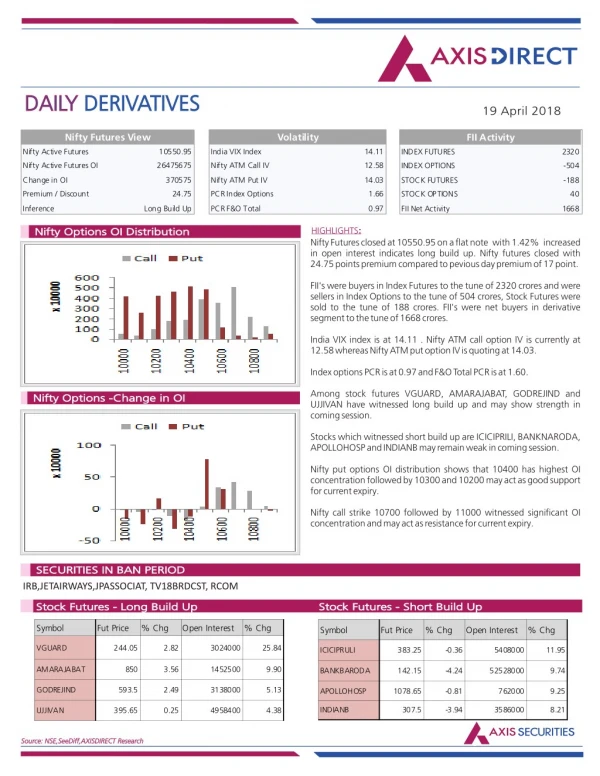
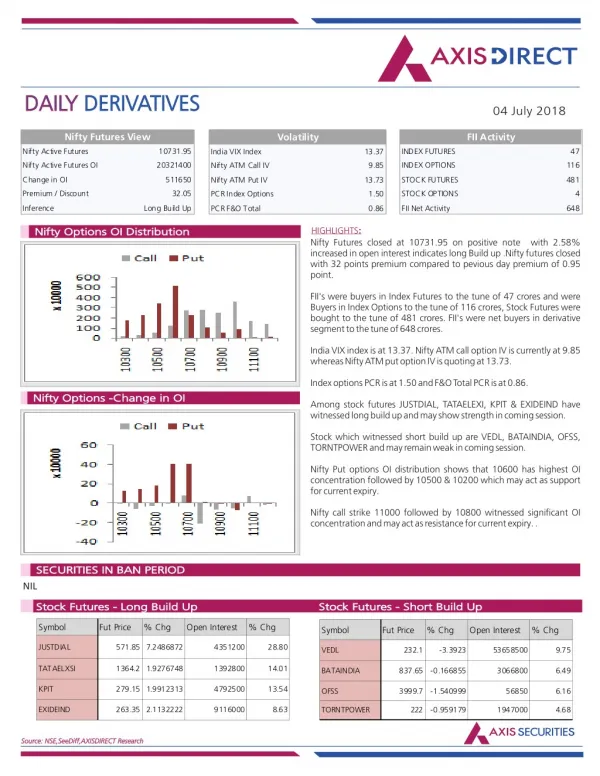
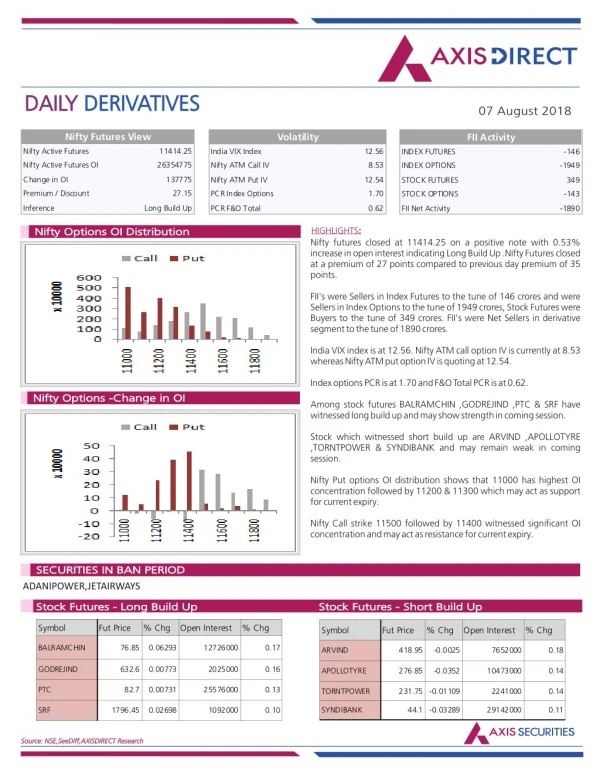
Axis Direct presents daily derivatives report presenting recommendations based on technical analysis. For trading in derivatives visit https://simplehai.axisdirect.in/offerings/products/derivatives<br>https://simplehai.axisdirect.in/share-stock-prices/nse/Infosys-Ltd-2806<br>https://simplehai.axisdirect.in/share-stock-prices/nse/Tata-Consultancy-Services-Ltd-5400<br>

E N D
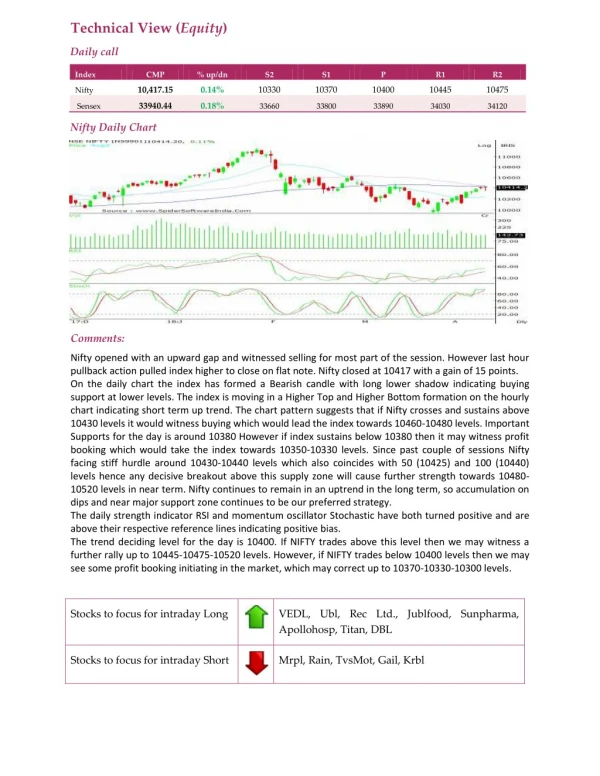
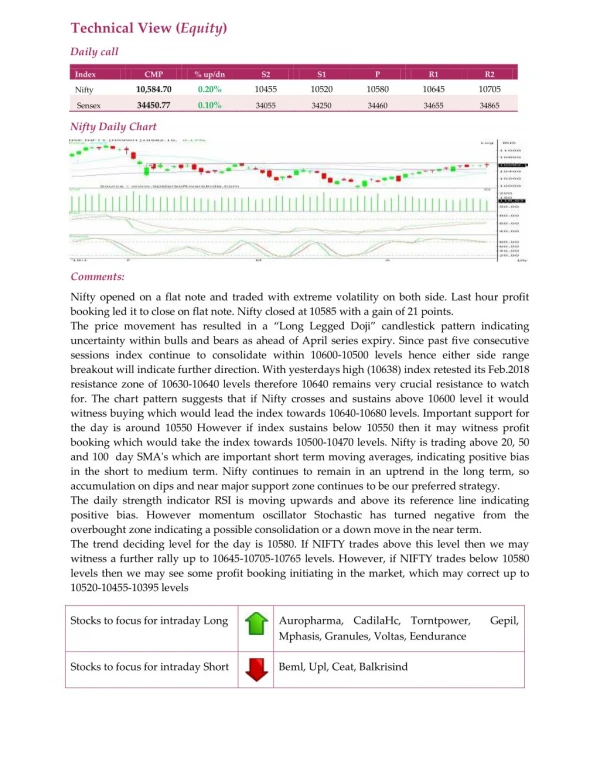
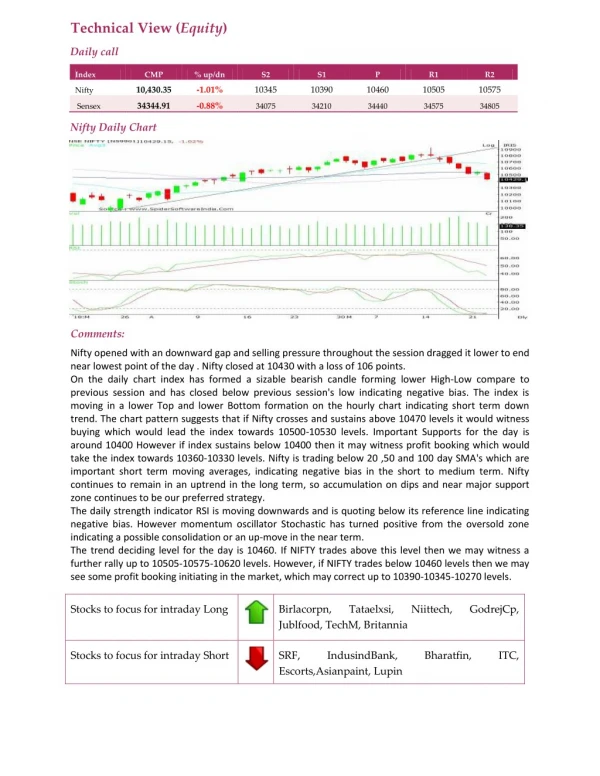
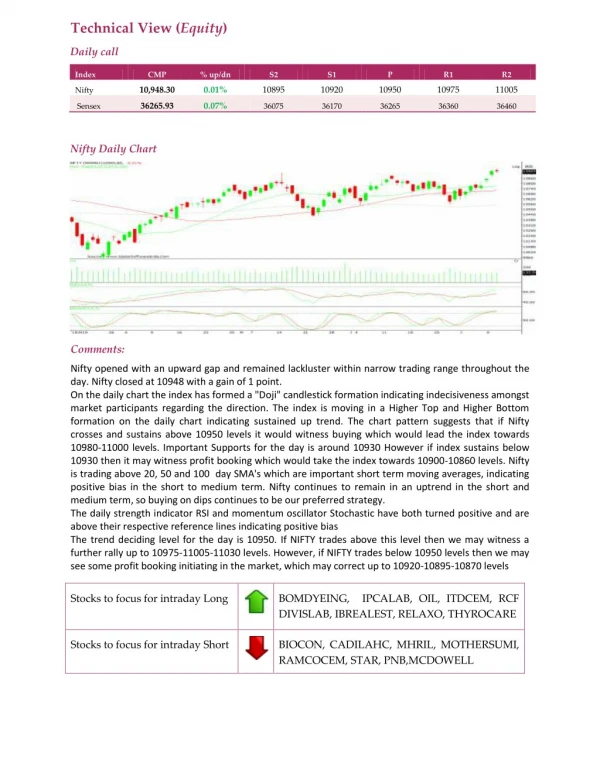
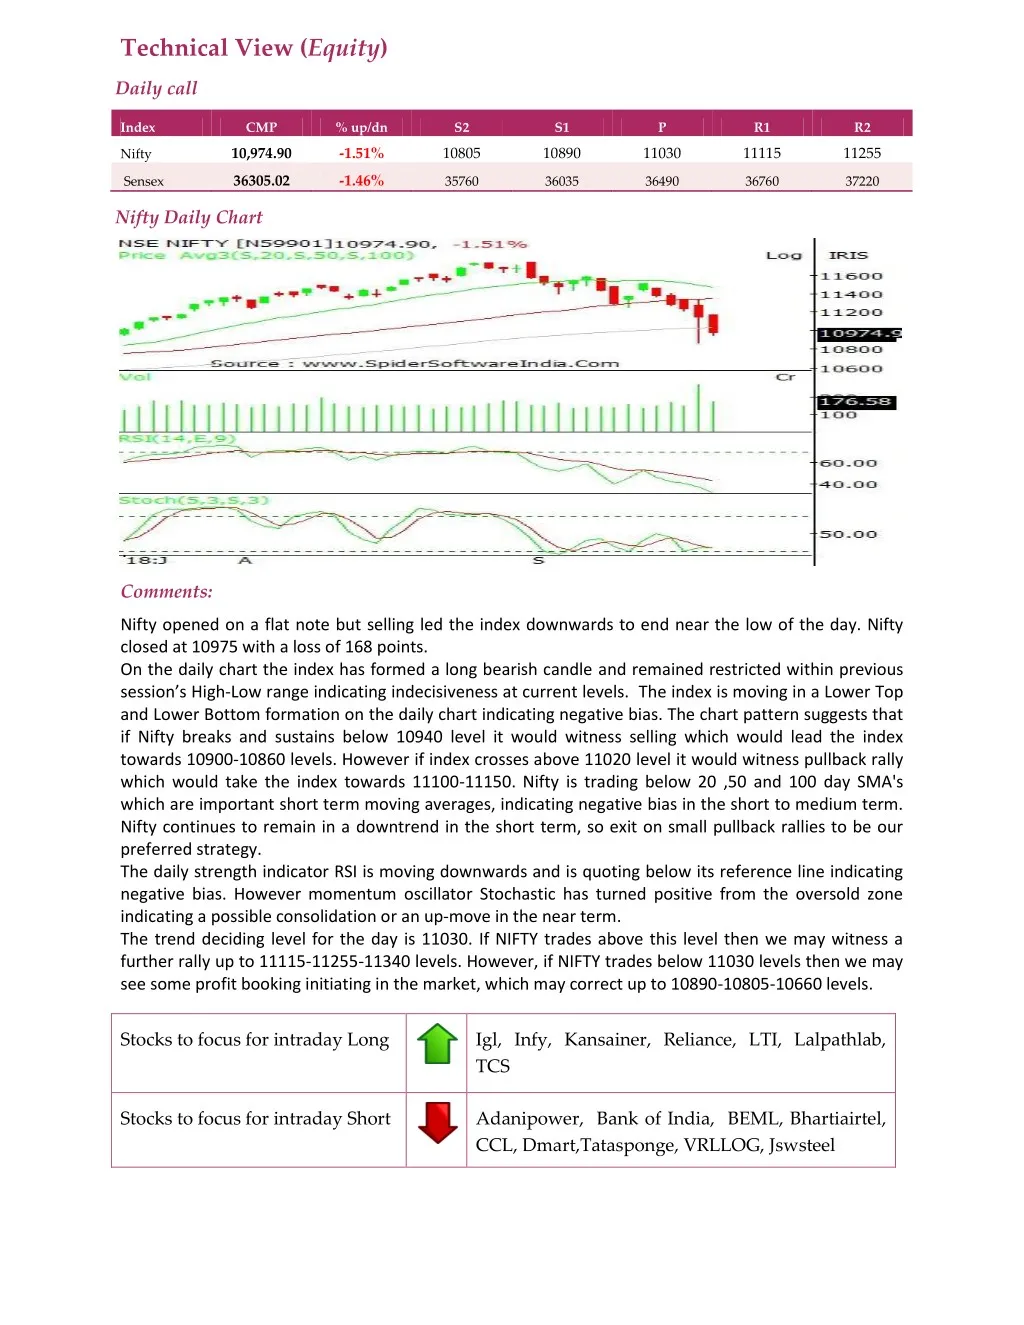
Technical View (Equity) Daily call Index CMP % up/dn S2 S1 P R1 R2 10,974.90 -1.51% 10805 10890 11030 11115 11255 Nifty 36305.02 -1.46% Sensex 35760 36035 36490 36760 37220 Nifty Daily Chart Comments: Nifty opened on a flat note but selling led the index downwards to end near the low of the day. Nifty closed at 10975 with a loss of 168 points. On the daily chart the index has formed a long bearish candle and remained restricted within previous session’s High-Low range indicating indecisiveness at current levels. The index is moving in a Lower Top and Lower Bottom formation on the daily chart indicating negative bias. The chart pattern suggests that if Nifty breaks and sustains below 10940 level it would witness selling which would lead the index towards 10900-10860 levels. However if index crosses above 11020 level it would witness pullback rally which would take the index towards 11100-11150. Nifty is trading below 20 ,50 and 100 day SMA's which are important short term moving averages, indicating negative bias in the short to medium term. Nifty continues to remain in a downtrend in the short term, so exit on small pullback rallies to be our preferred strategy. The daily strength indicator RSI is moving downwards and is quoting below its reference line indicating negative bias. However momentum oscillator Stochastic has turned positive from the oversold zone indicating a possible consolidation or an up-move in the near term. The trend deciding level for the day is 11030. If NIFTY trades above this level then we may witness a further rally up to 11115-11255-11340 levels. However, if NIFTY trades below 11030 levels then we may see some profit booking initiating in the market, which may correct up to 10890-10805-10660 levels. Stocks to focus for intraday Long Igl, Infy, Kansainer, Reliance, LTI, Lalpathlab, TCS Stocks to focus for intraday Short Adanipower, Bank of India, BEML, Bhartiairtel, CCL, Dmart,Tatasponge, VRLLOG, Jswsteel