Download
1 / 1
10 likes | 16 Views
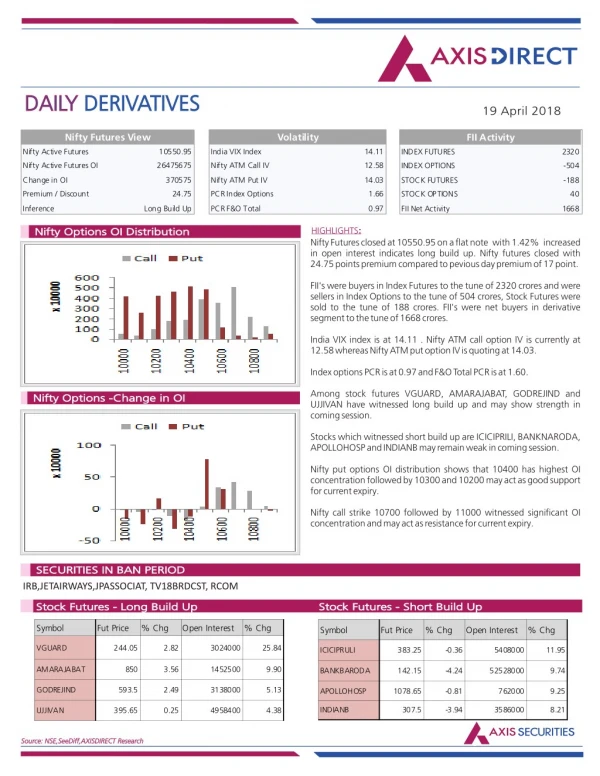
Axis Direct presents daily derivatives report presenting recommendations based on technical analysis. For trading in derivatives visit https://simplehai.axisdirect.in/offerings/products/derivatives<br>https://simplehai.axisdirect.in/share-stock-prices/nse/Adani-Power-Ltd-17808<br>https://simplehai.axisdirect.in/share-stock-prices/nse/Delta-Corp-Ltd-17211<br>

E N D
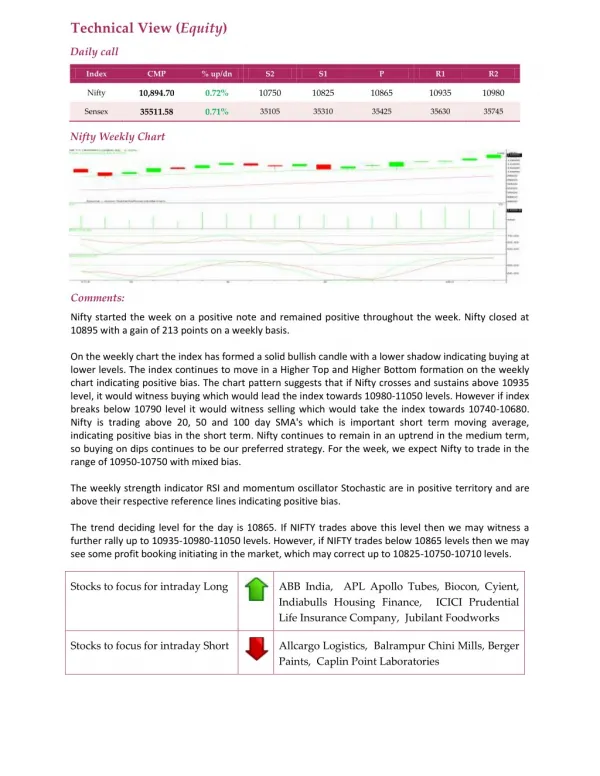
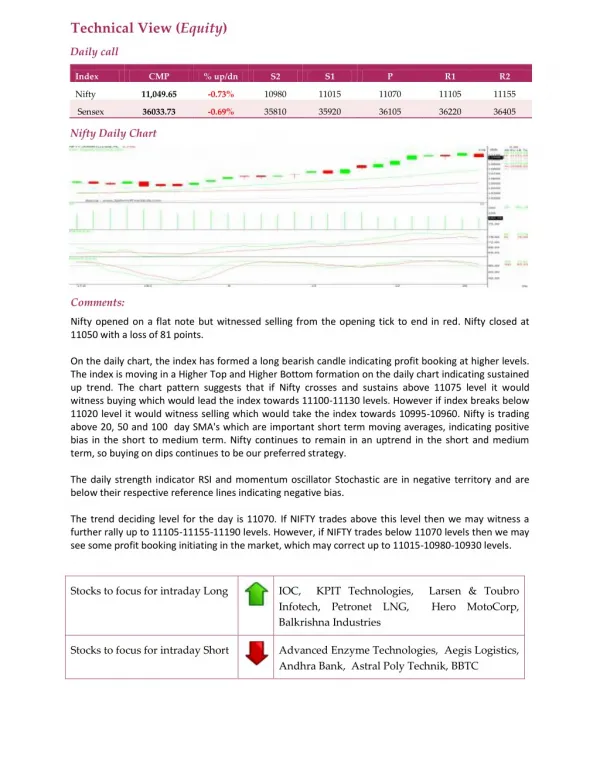
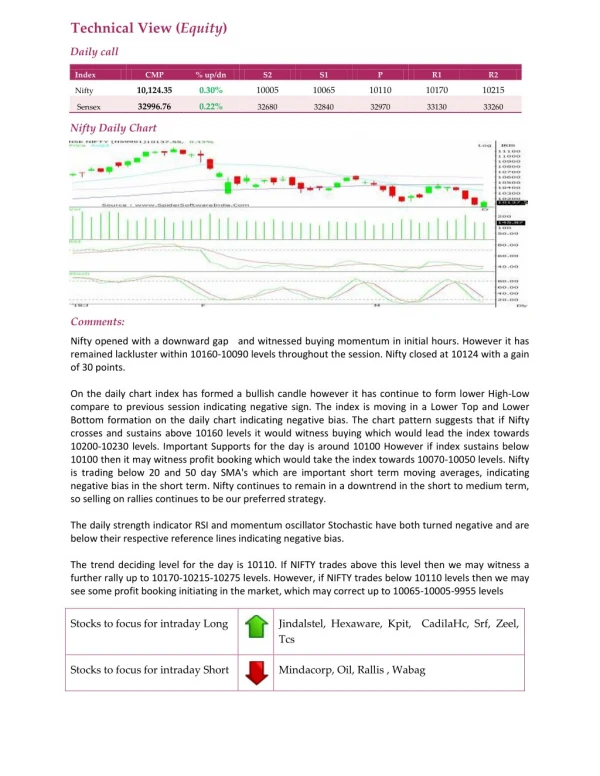
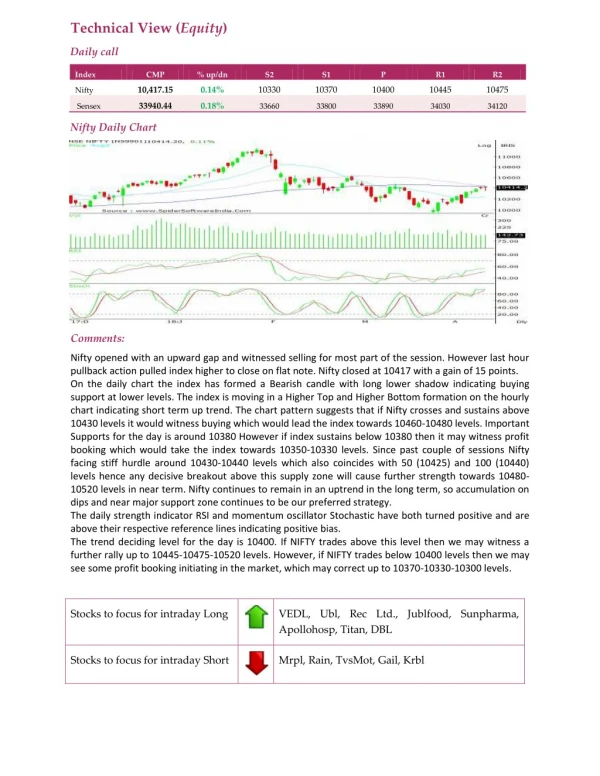
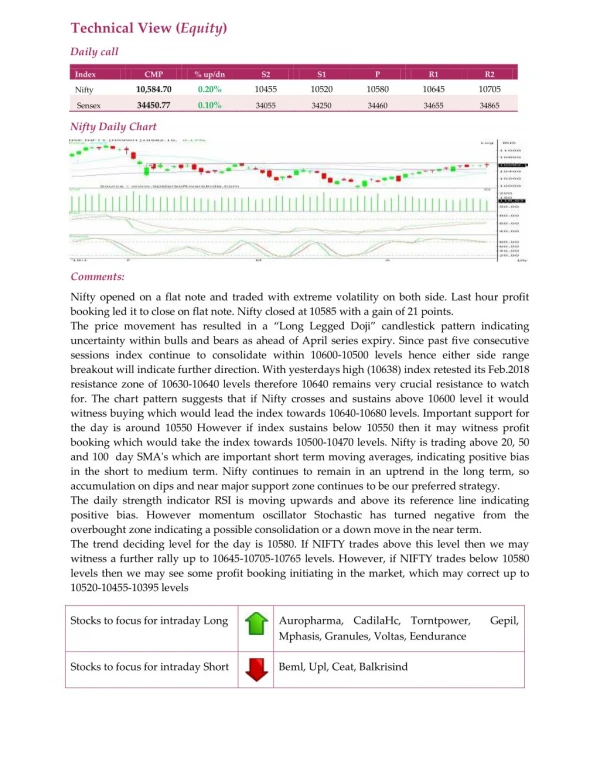
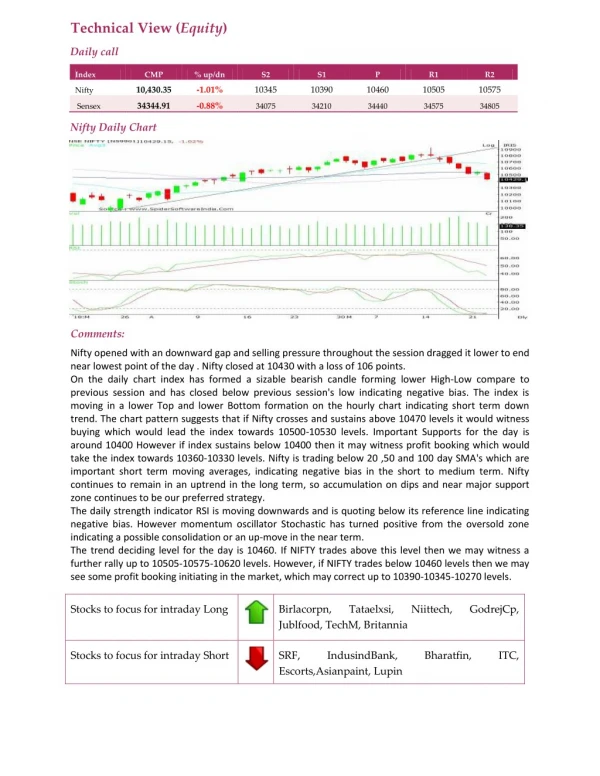
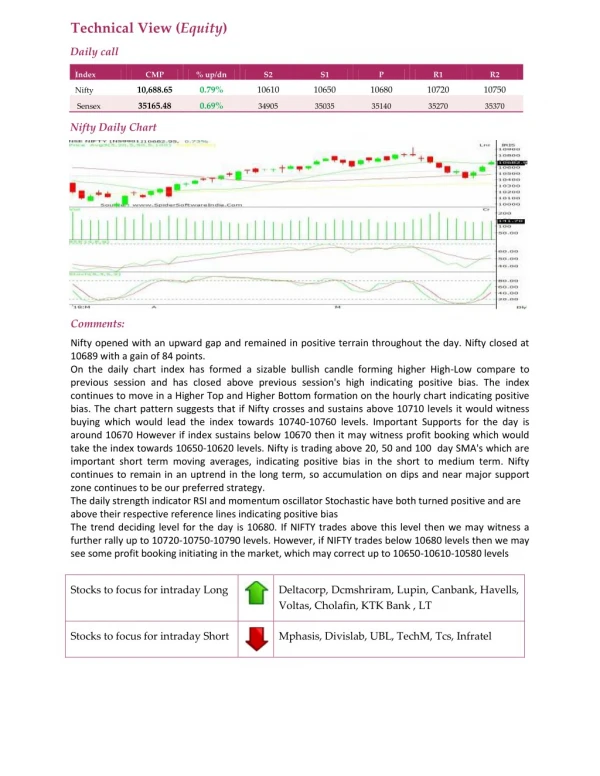
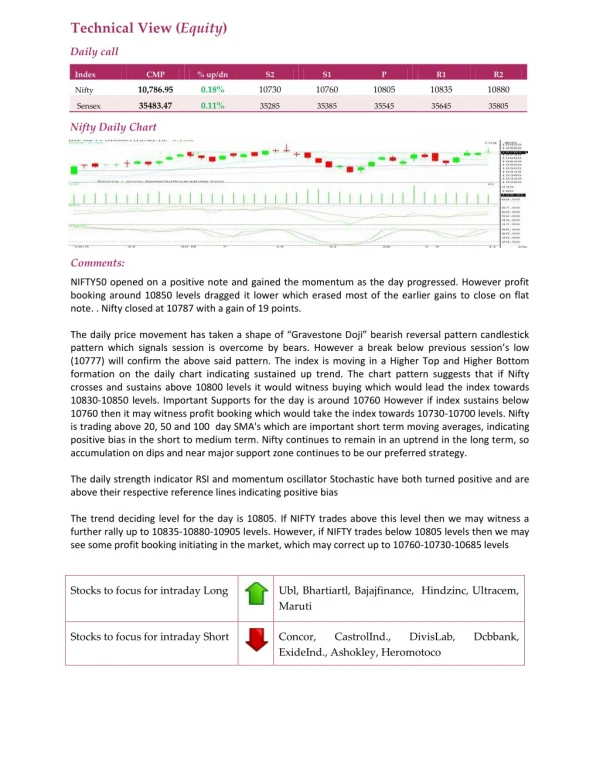
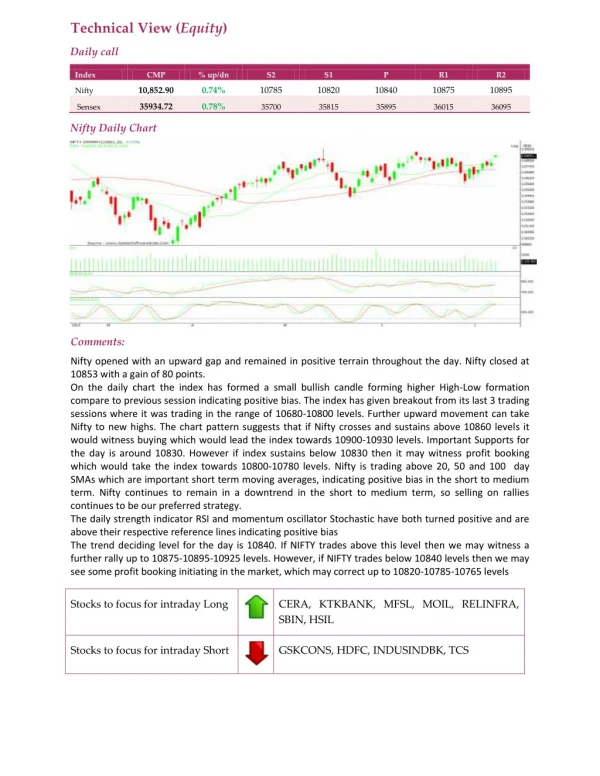
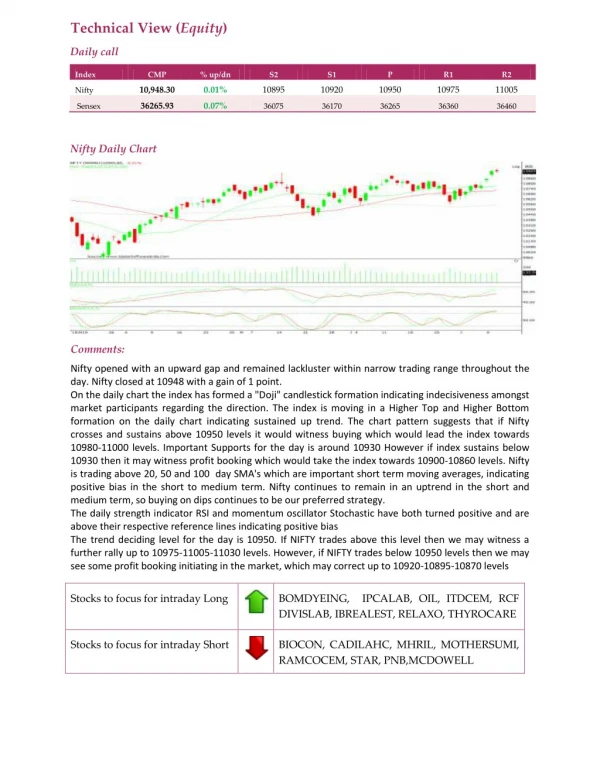
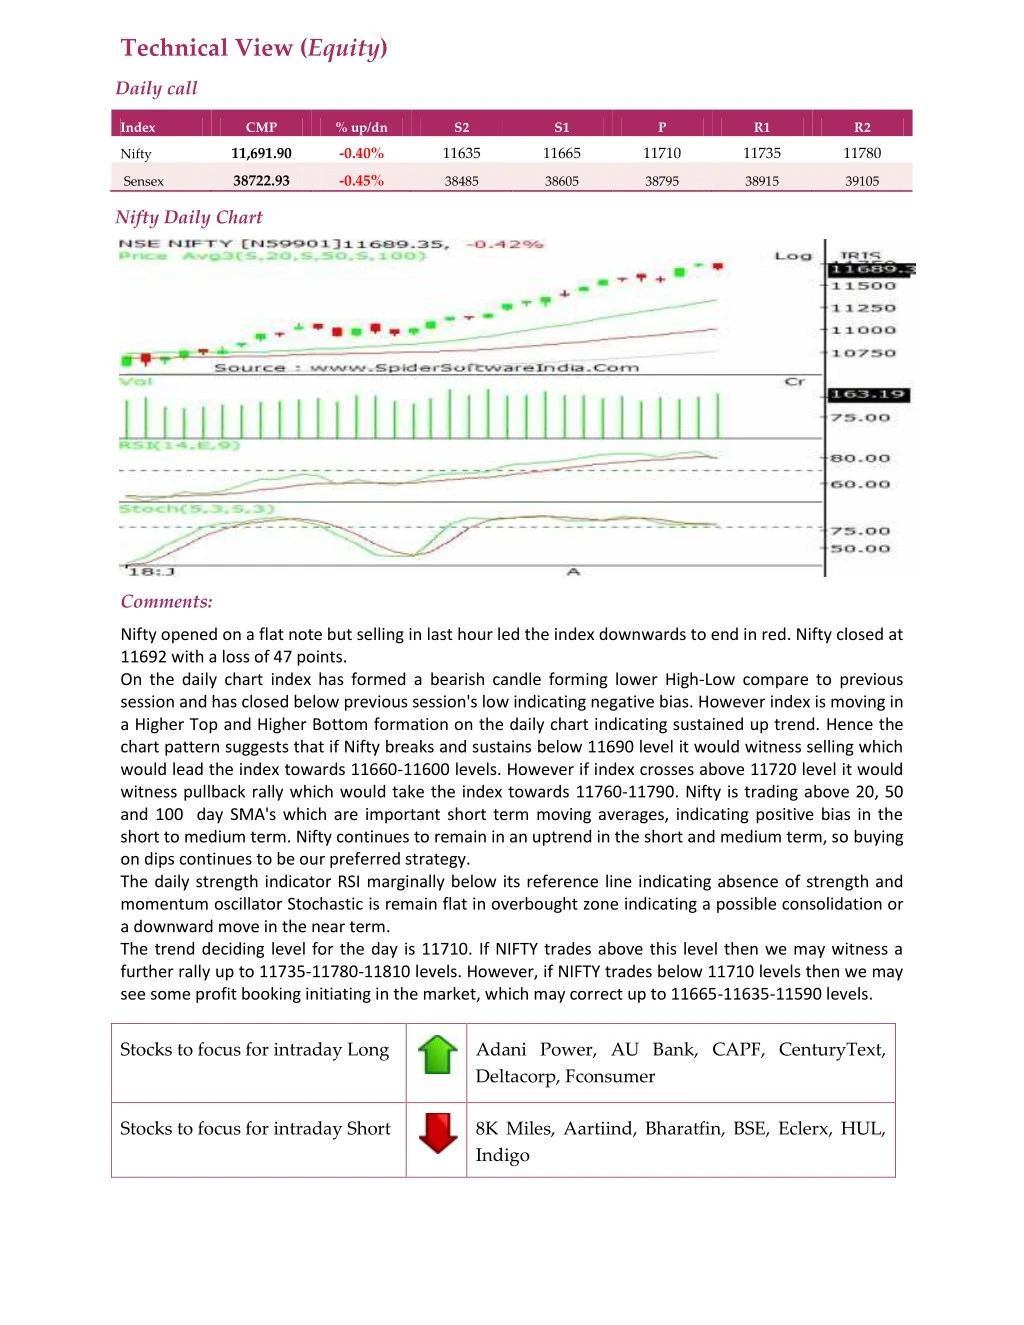
Technical View (Equity) Daily call Index CMP % up/dn S2 S1 P R1 R2 11,691.90 -0.40% 11635 11665 11710 11735 11780 Nifty 38722.93 -0.45% Sensex 38485 38605 38795 38915 39105 Nifty Daily Chart Comments: Nifty opened on a flat note but selling in last hour led the index downwards to end in red. Nifty closed at 11692 with a loss of 47 points. On the daily chart index has formed a bearish candle forming lower High-Low compare to previous session and has closed below previous session's low indicating negative bias. However index is moving in a Higher Top and Higher Bottom formation on the daily chart indicating sustained up trend. Hence the chart pattern suggests that if Nifty breaks and sustains below 11690 level it would witness selling which would lead the index towards 11660-11600 levels. However if index crosses above 11720 level it would witness pullback rally which would take the index towards 11760-11790. Nifty is trading above 20, 50 and 100 day SMA's which are important short term moving averages, indicating positive bias in the short to medium term. Nifty continues to remain in an uptrend in the short and medium term, so buying on dips continues to be our preferred strategy. The daily strength indicator RSI marginally below its reference line indicating absence of strength and momentum oscillator Stochastic is remain flat in overbought zone indicating a possible consolidation or a downward move in the near term. The trend deciding level for the day is 11710. If NIFTY trades above this level then we may witness a further rally up to 11735-11780-11810 levels. However, if NIFTY trades below 11710 levels then we may see some profit booking initiating in the market, which may correct up to 11665-11635-11590 levels. Stocks to focus for intraday Long Adani Power, AU Bank, CAPF, CenturyText, Deltacorp, Fconsumer Stocks to focus for intraday Short 8K Miles, Aartiind, Bharatfin, BSE, Eclerx, HUL, Indigo