Download
1 / 1
10 likes | 14 Views
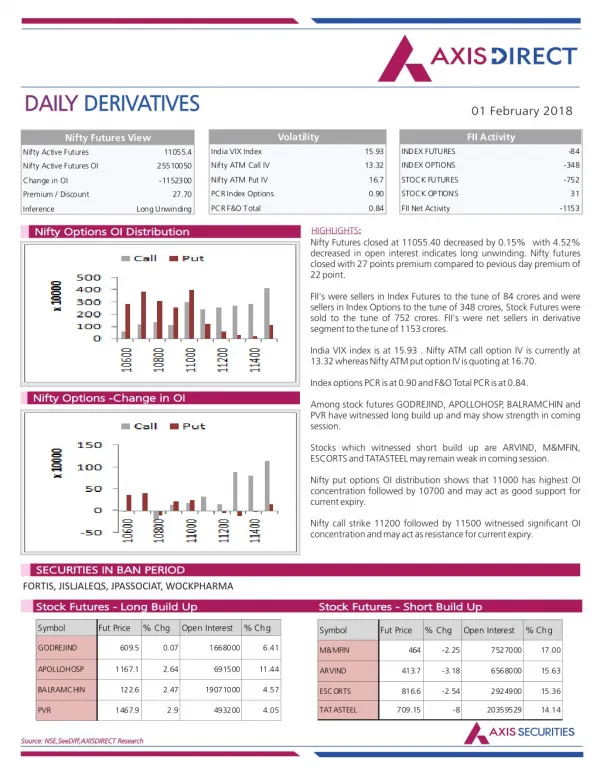
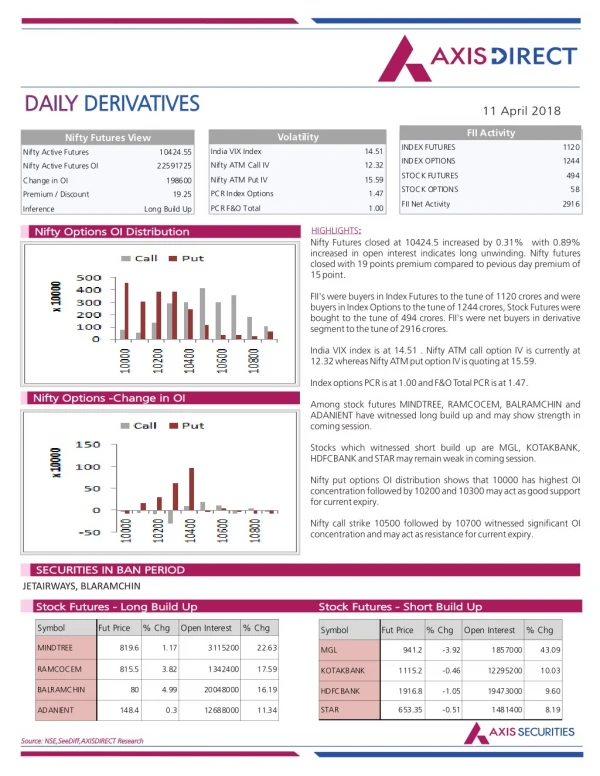
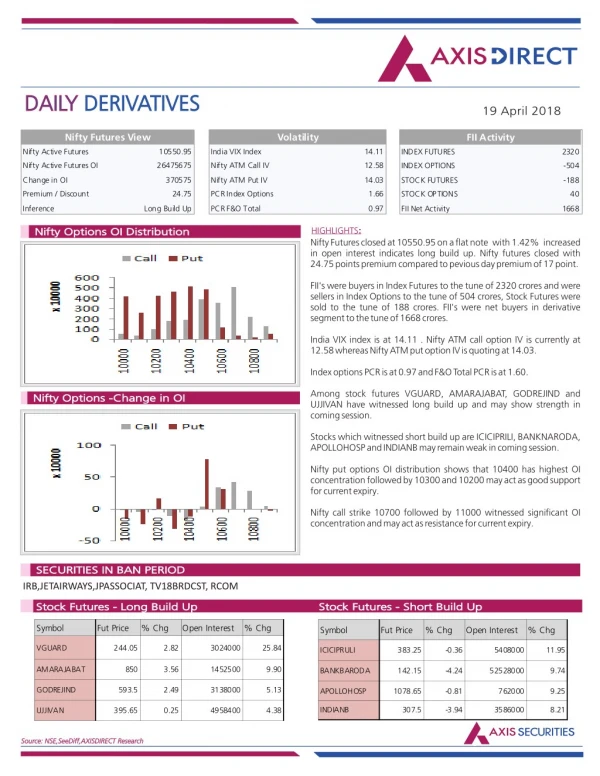
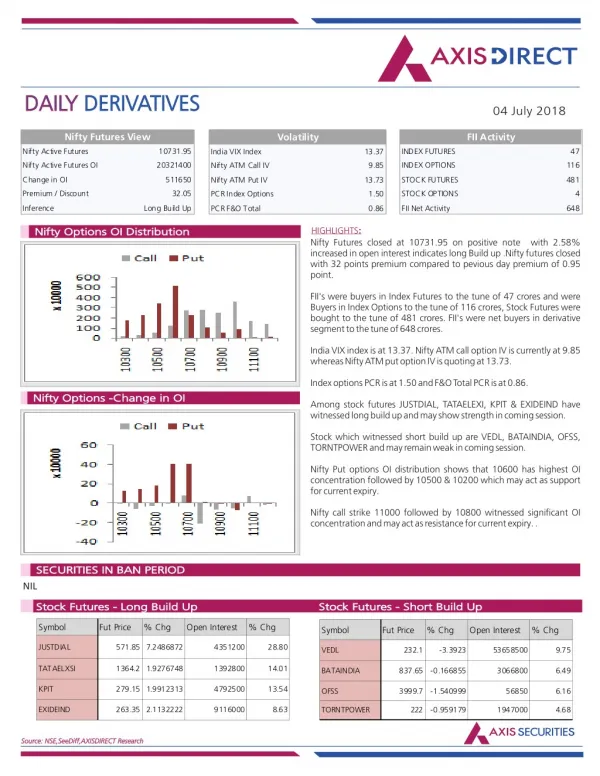
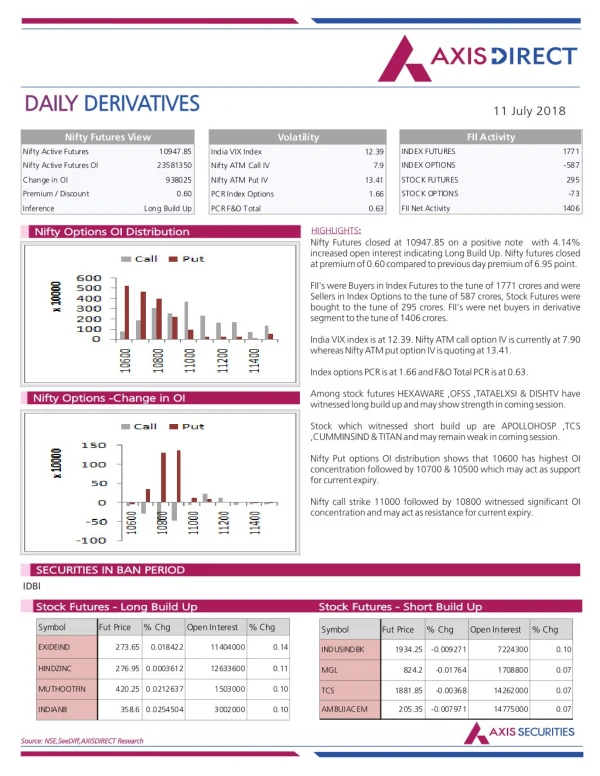
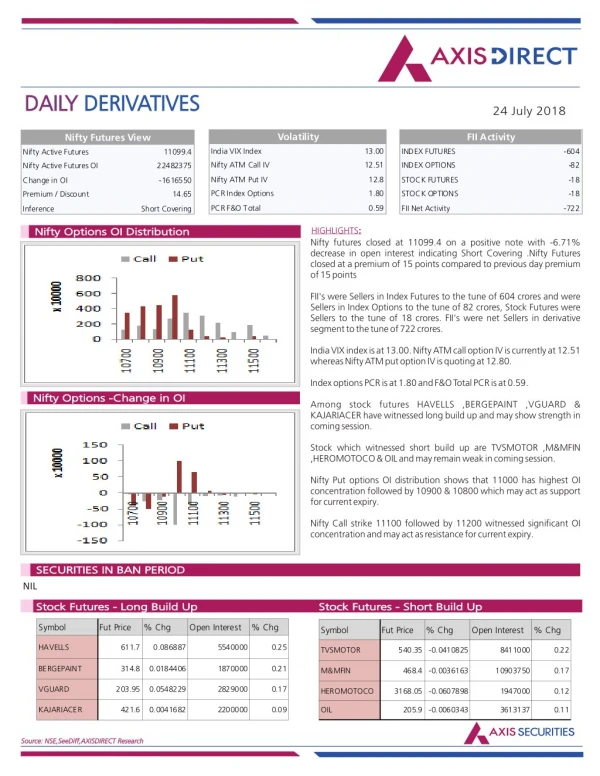
Axis Direct presents daily derivatives report presenting recommendations based on technical analysis. For trading in derivatives visit https://simplehai.axisdirect.in/offerings/products/derivatives<br>https://simplehai.axisdirect.in/share-stock-prices/nse/CEAT-Ltd-104<br>https://simplehai.axisdirect.in/share-stock-prices/nse/DLF-Ltd-6890<br>

E N D
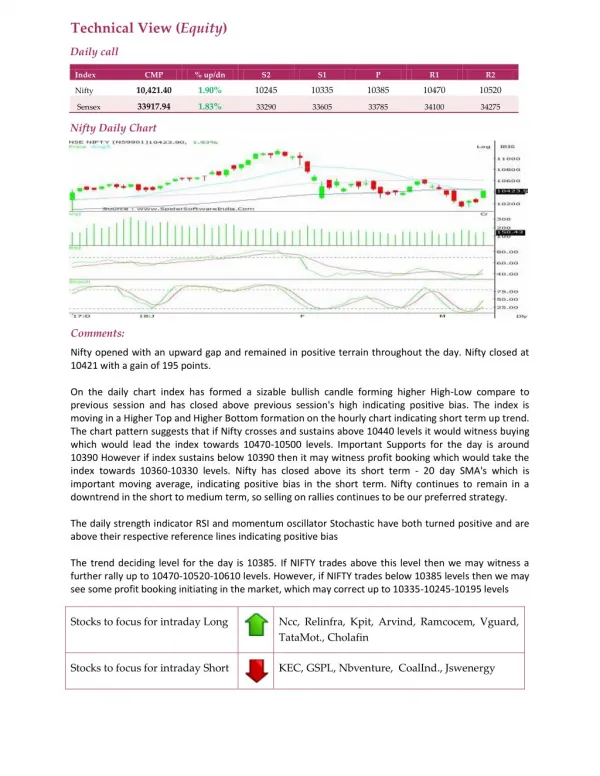
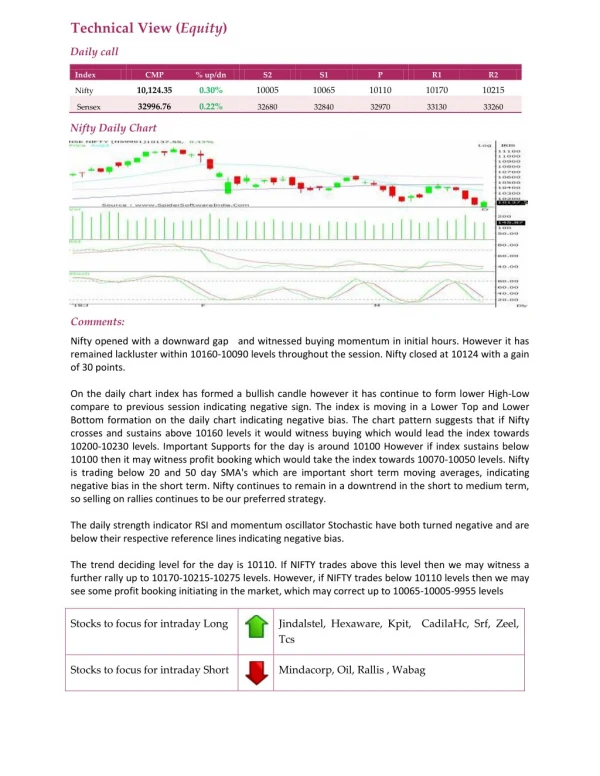
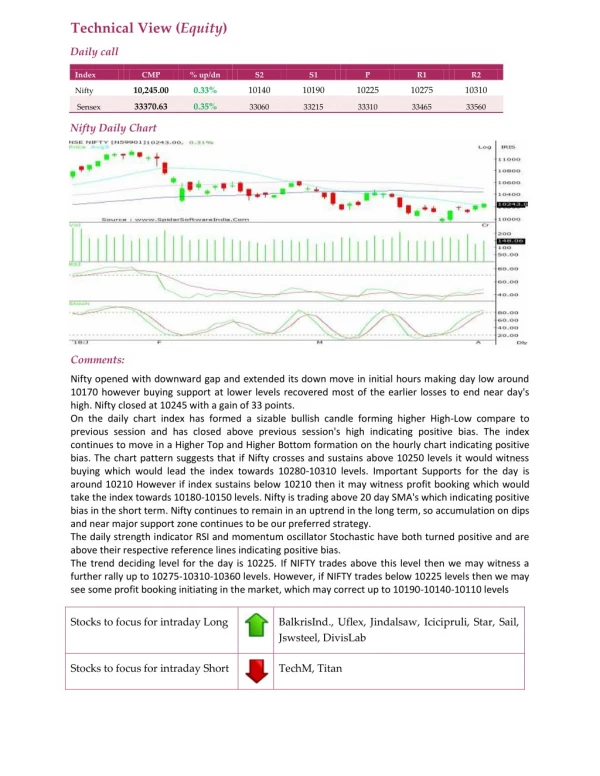
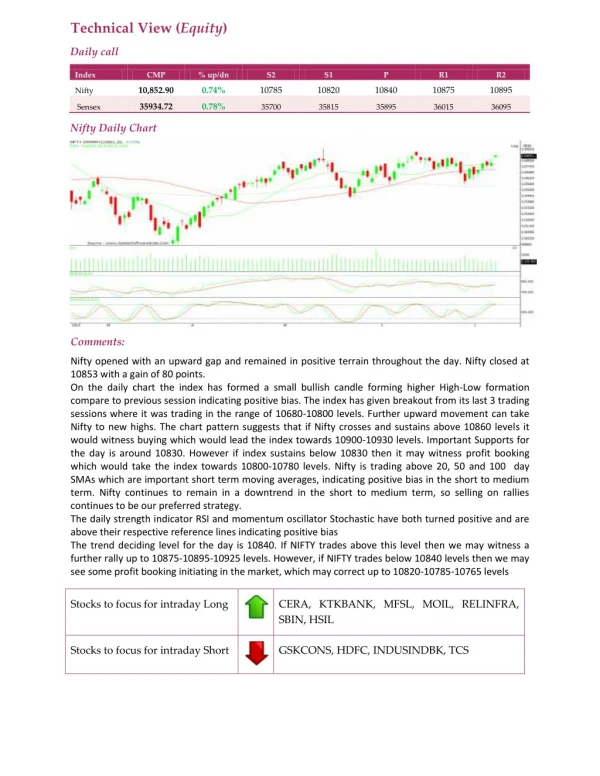
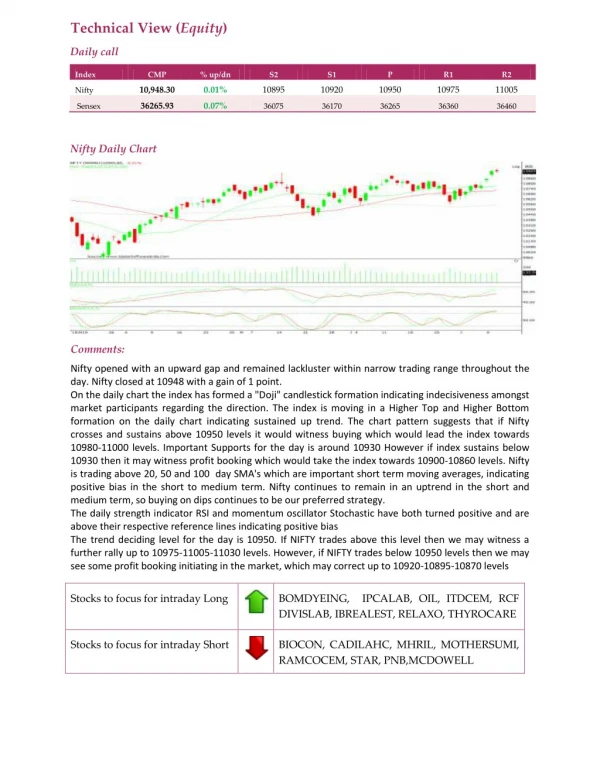
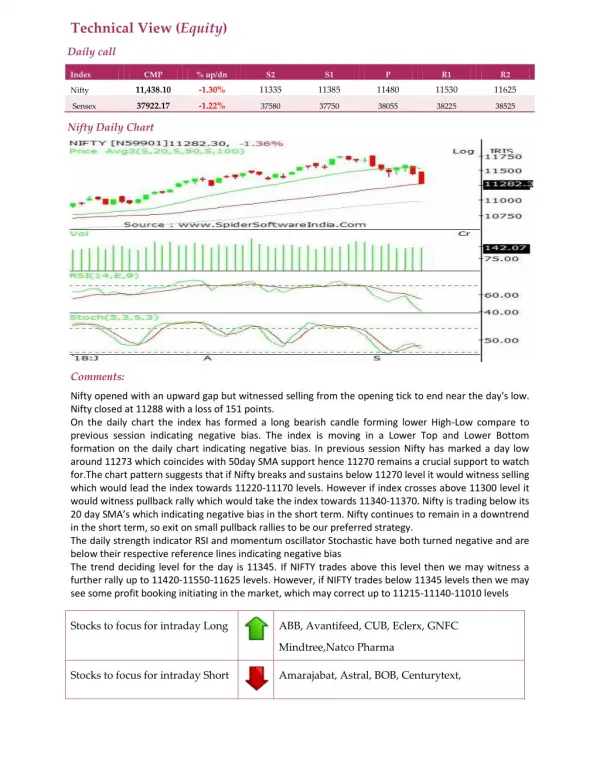
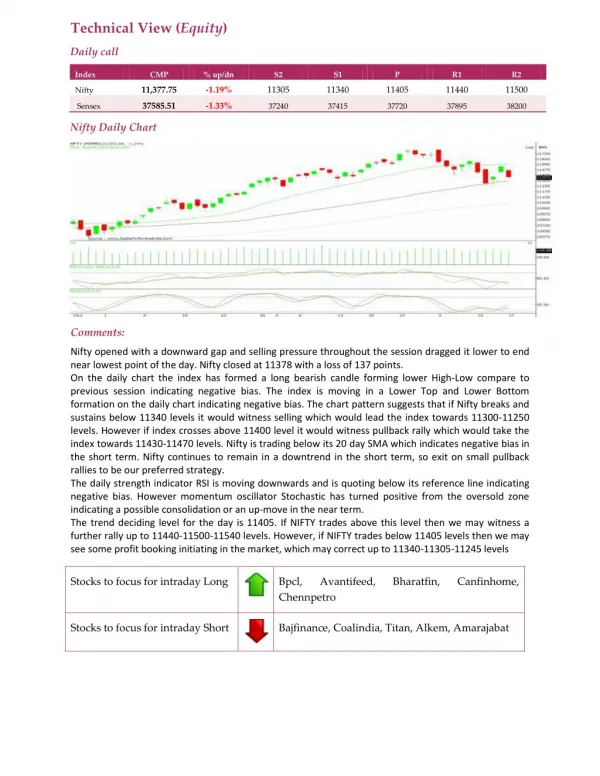
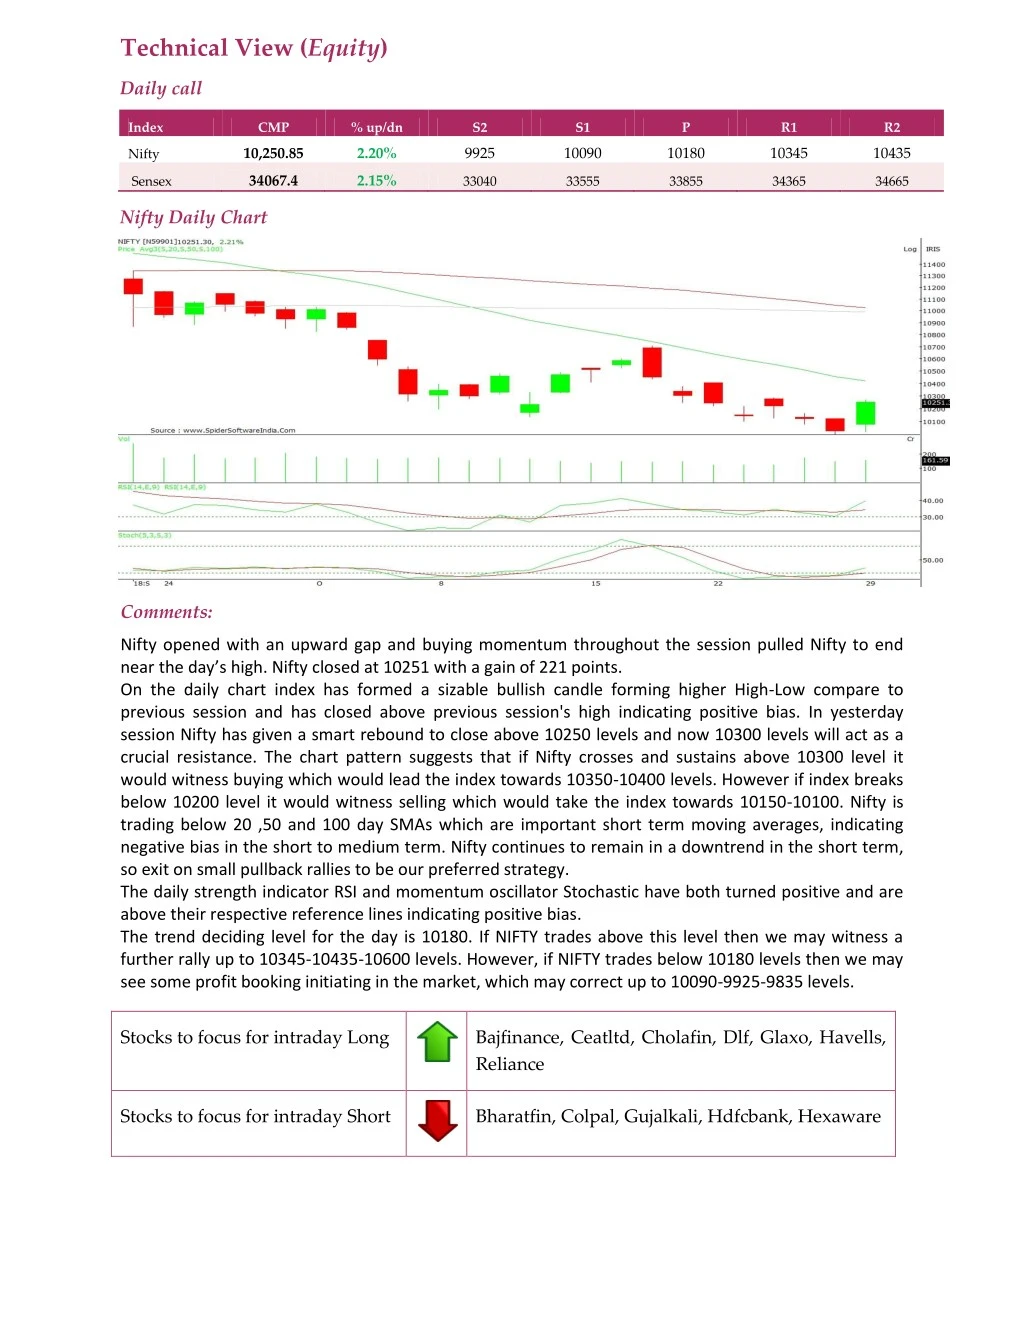
Technical View (Equity) Daily call Index CMP % up/dn S2 S1 P R1 R2 10,250.85 2.20% 9925 10090 10180 10345 10435 Nifty 34067.4 2.15% Sensex 33040 33555 33855 34365 34665 Nifty Daily Chart Comments: Nifty opened with an upward gap and buying momentum throughout the session pulled Nifty to end near the day’s high. Nifty closed at 10251 with a gain of 221 points. On the daily chart index has formed a sizable bullish candle forming higher High-Low compare to previous session and has closed above previous session's high indicating positive bias. In yesterday session Nifty has given a smart rebound to close above 10250 levels and now 10300 levels will act as a crucial resistance. The chart pattern suggests that if Nifty crosses and sustains above 10300 level it would witness buying which would lead the index towards 10350-10400 levels. However if index breaks below 10200 level it would witness selling which would take the index towards 10150-10100. Nifty is trading below 20 ,50 and 100 day SMAs which are important short term moving averages, indicating negative bias in the short to medium term. Nifty continues to remain in a downtrend in the short term, so exit on small pullback rallies to be our preferred strategy. The daily strength indicator RSI and momentum oscillator Stochastic have both turned positive and are above their respective reference lines indicating positive bias. The trend deciding level for the day is 10180. If NIFTY trades above this level then we may witness a further rally up to 10345-10435-10600 levels. However, if NIFTY trades below 10180 levels then we may see some profit booking initiating in the market, which may correct up to 10090-9925-9835 levels. Stocks to focus for intraday Long Bajfinance, Ceatltd, Cholafin, Dlf, Glaxo, Havells, Reliance Stocks to focus for intraday Short Bharatfin, Colpal, Gujalkali, Hdfcbank, Hexaware