Download
1 / 1
10 likes | 12 Views
Axis Direct presents daily derivatives report presenting recommendations based on technical analysis. For trading in derivatives visit https://simplehai.axisdirect.in/offerings/products/derivatives<br>https://simplehai.axisdirect.in/share-stock-prices/nse/Cipla-Ltd-114<br>https://simplehai.axisdirect.in/share-stock-prices/nse/Wipro-Ltd-614<br>https://simplehai.axisdirect.in/share-stock-prices/nse/Coal-India-Ltd-12019<br>https://simplehai.axisdirect.in/share-stock-prices/nse/ICICI-Bank-Ltd-5418

E N D
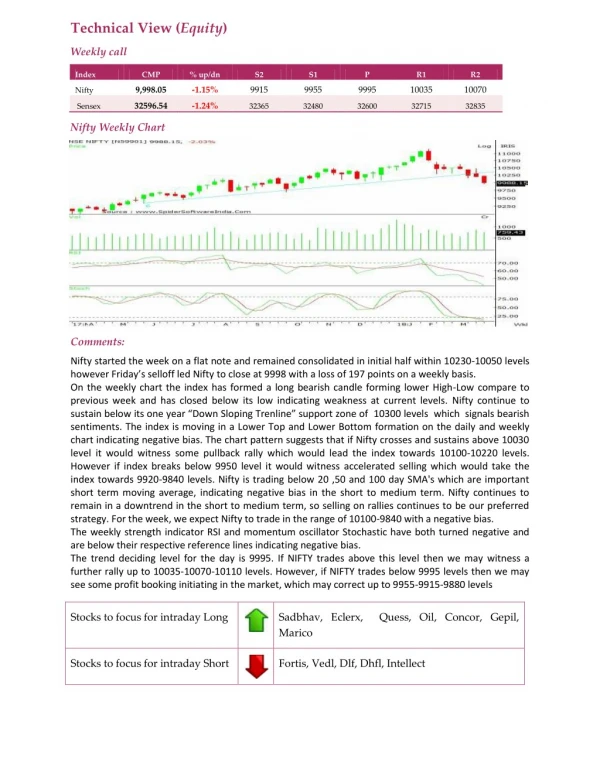
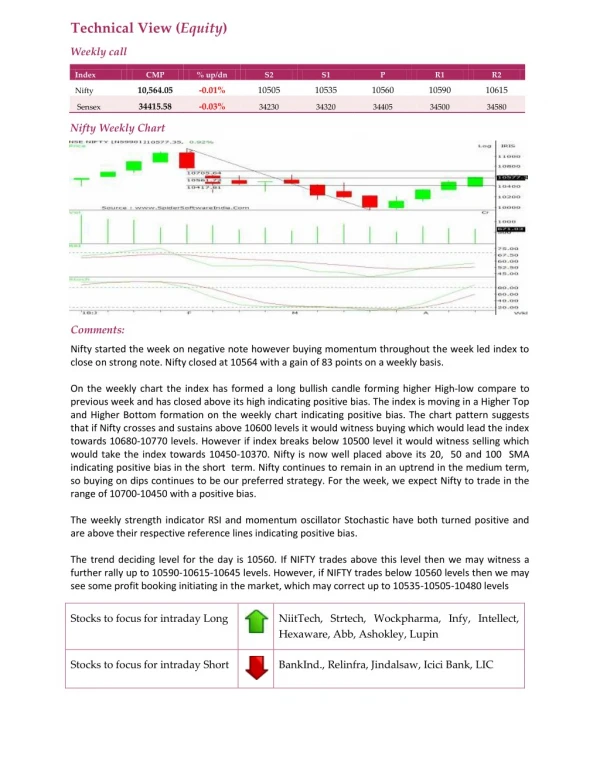
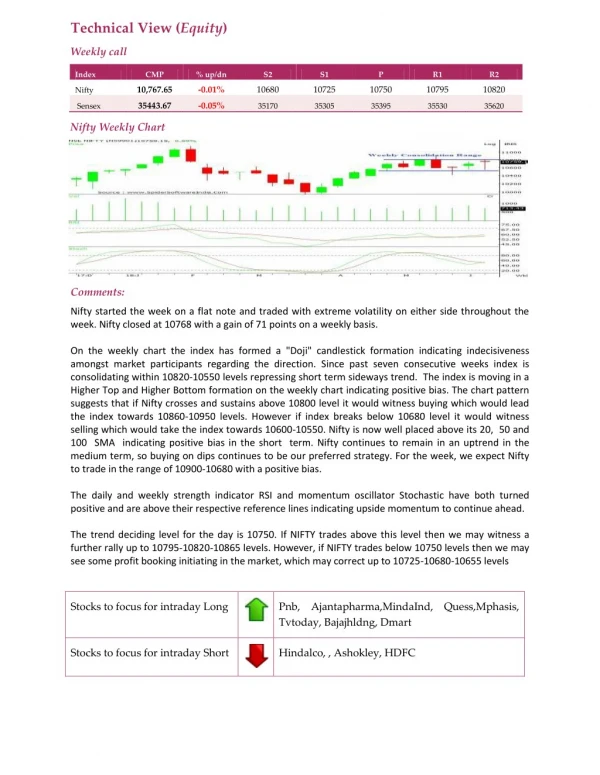
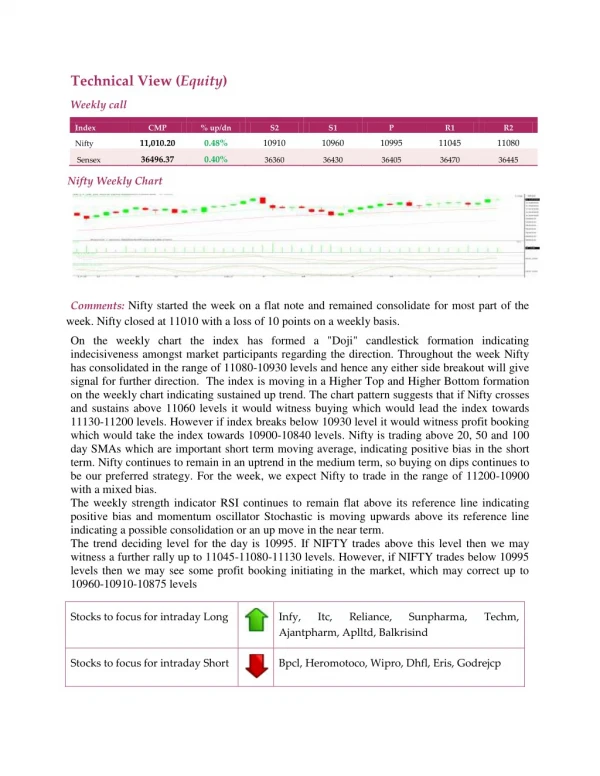
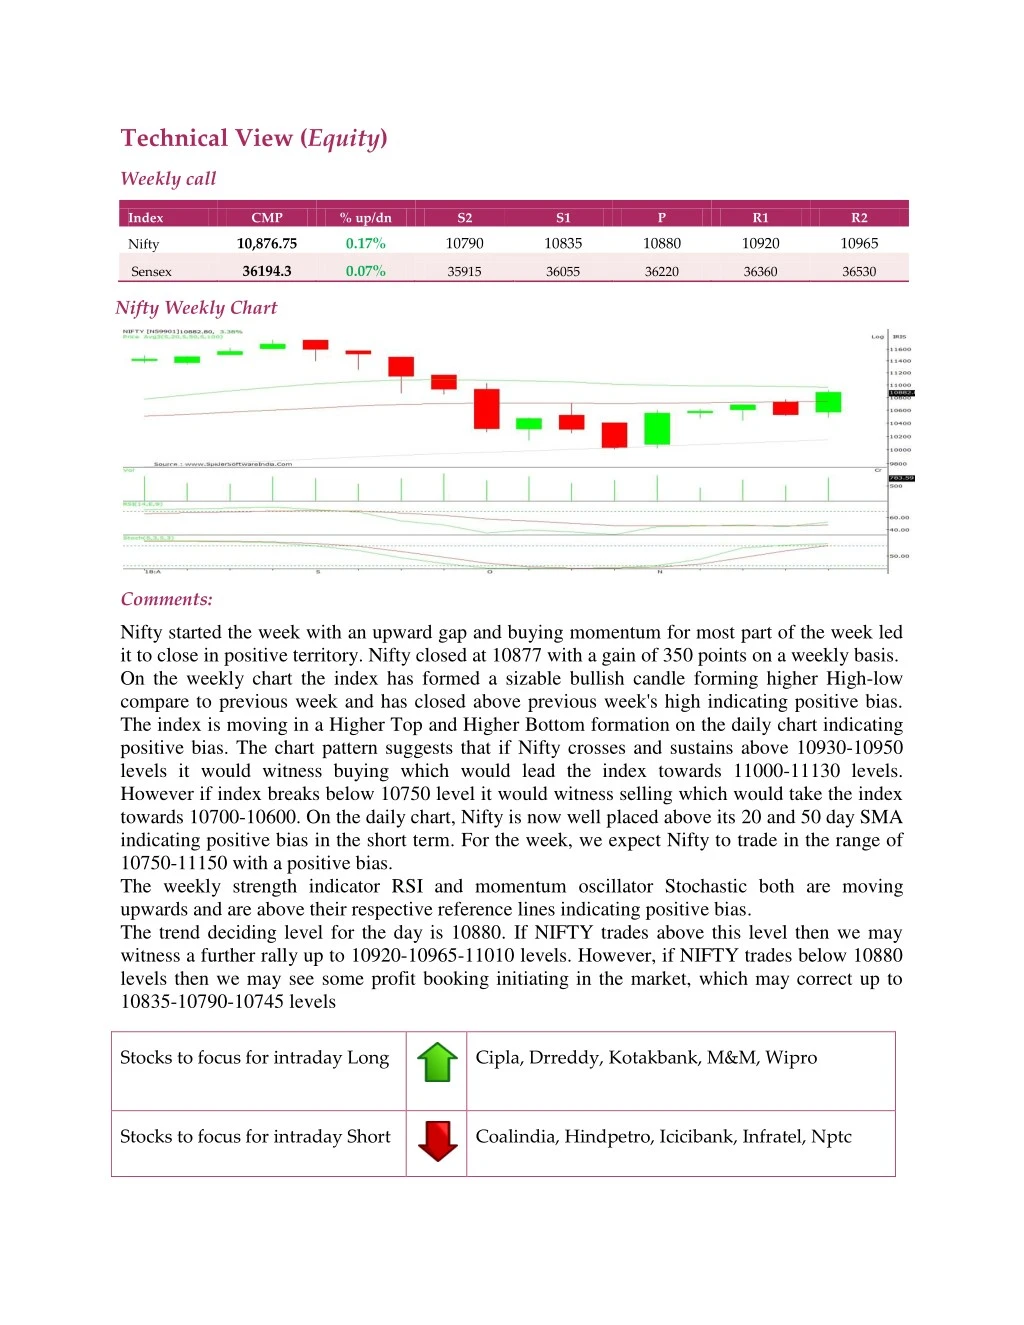
Technical View (Equity) Weekly call Index CMP % up/dn S2 S1 P R1 R2 10,876.75 0.17% 10790 10835 10880 10920 10965 Nifty 36194.3 0.07% Sensex 35915 36055 36220 36360 36530 Nifty Weekly Chart Comments: Nifty started the week with an upward gap and buying momentum for most part of the week led it to close in positive territory. Nifty closed at 10877 with a gain of 350 points on a weekly basis. On the weekly chart the index has formed a sizable bullish candle forming higher High-low compare to previous week and has closed above previous week's high indicating positive bias. The index is moving in a Higher Top and Higher Bottom formation on the daily chart indicating positive bias. The chart pattern suggests that if Nifty crosses and sustains above 10930-10950 levels it would witness buying which would lead the index towards 11000-11130 levels. However if index breaks below 10750 level it would witness selling which would take the index towards 10700-10600. On the daily chart, Nifty is now well placed above its 20 and 50 day SMA indicating positive bias in the short term. For the week, we expect Nifty to trade in the range of 10750-11150 with a positive bias. The weekly strength indicator RSI and momentum oscillator Stochastic both are moving upwards and are above their respective reference lines indicating positive bias. The trend deciding level for the day is 10880. If NIFTY trades above this level then we may witness a further rally up to 10920-10965-11010 levels. However, if NIFTY trades below 10880 levels then we may see some profit booking initiating in the market, which may correct up to 10835-10790-10745 levels Stocks to focus for intraday Long Cipla, Drreddy, Kotakbank, M&M, Wipro Stocks to focus for intraday Short Coalindia, Hindpetro, Icicibank, Infratel, Nptc