Download
1 / 1
10 likes | 13 Views
Axis Direct presents daily derivatives report presenting recommendations based on technical analysis. For trading in derivatives visit https://simplehai.axisdirect.in/offerings/products/derivatives<br>https://simplehai.axisdirect.in/share-stock-prices/nse/Lupin-Ltd-3026<br>https://simplehai.axisdirect.in/share-stock-prices/nse/Oil-&-Natural-Gas-Corpn-Ltd-6068<br>https://simplehai.axisdirect.in/share-stock-prices/nse/State-Bank-of-India-1375<br>

E N D
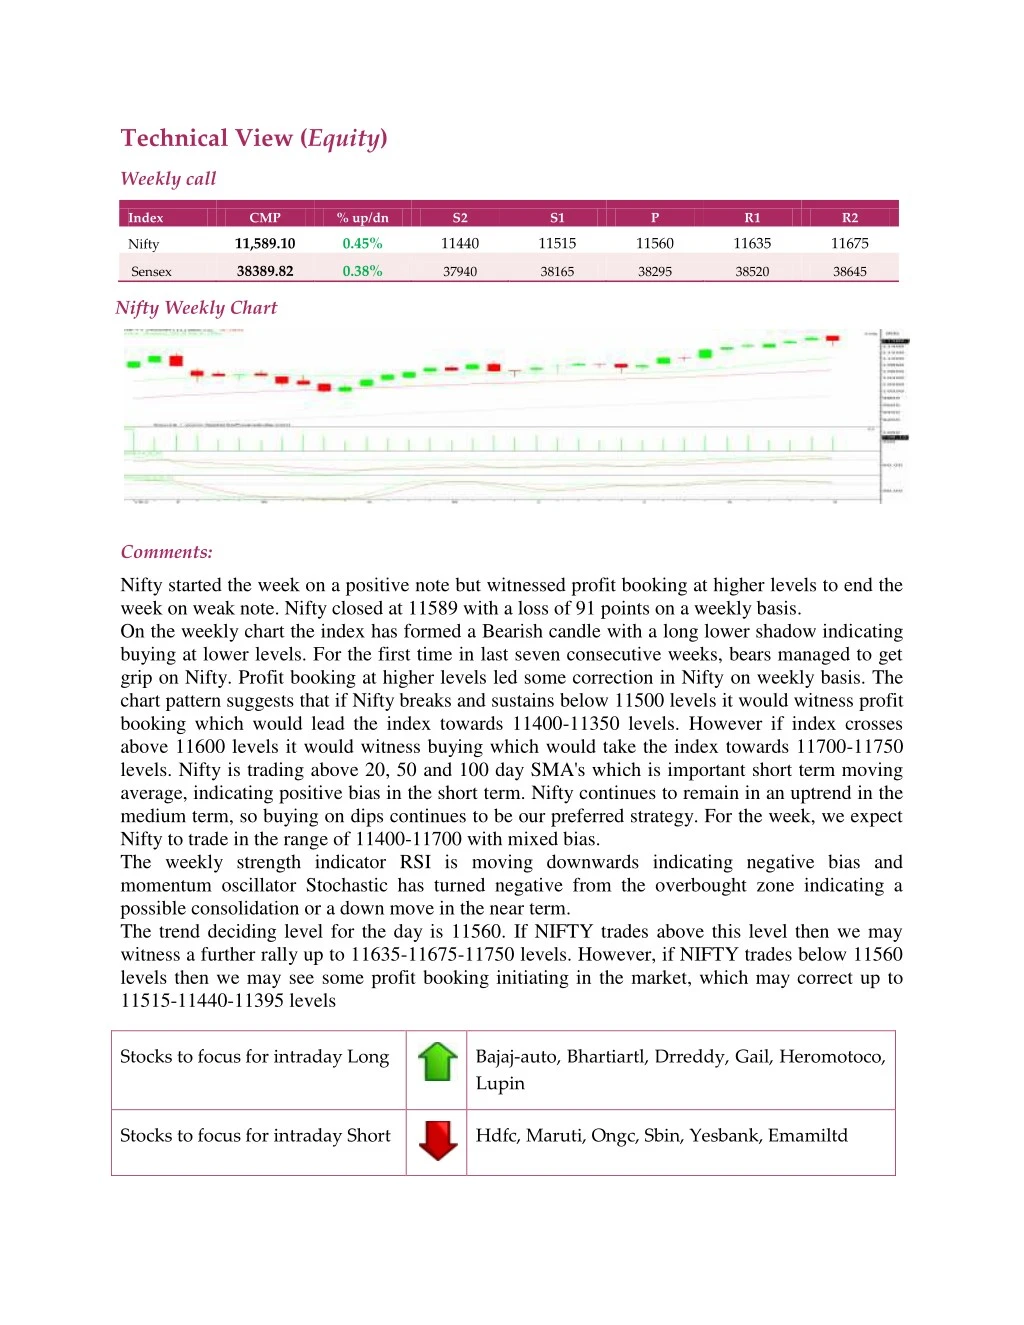
Technical View (Equity) Weekly call Index CMP % up/dn S2 S1 P R1 R2 11,589.10 0.45% 11440 11515 11560 11635 11675 Nifty 38389.82 0.38% Sensex 37940 38165 38295 38520 38645 Nifty Weekly Chart Comments: Nifty started the week on a positive note but witnessed profit booking at higher levels to end the week on weak note. Nifty closed at 11589 with a loss of 91 points on a weekly basis. On the weekly chart the index has formed a Bearish candle with a long lower shadow indicating buying at lower levels. For the first time in last seven consecutive weeks, bears managed to get grip on Nifty. Profit booking at higher levels led some correction in Nifty on weekly basis. The chart pattern suggests that if Nifty breaks and sustains below 11500 levels it would witness profit booking which would lead the index towards 11400-11350 levels. However if index crosses above 11600 levels it would witness buying which would take the index towards 11700-11750 levels. Nifty is trading above 20, 50 and 100 day SMA's which is important short term moving average, indicating positive bias in the short term. Nifty continues to remain in an uptrend in the medium term, so buying on dips continues to be our preferred strategy. For the week, we expect Nifty to trade in the range of 11400-11700 with mixed bias. The weekly strength indicator RSI is moving downwards indicating negative bias and momentum oscillator Stochastic has turned negative from the overbought zone indicating a possible consolidation or a down move in the near term. The trend deciding level for the day is 11560. If NIFTY trades above this level then we may witness a further rally up to 11635-11675-11750 levels. However, if NIFTY trades below 11560 levels then we may see some profit booking initiating in the market, which may correct up to 11515-11440-11395 levels Stocks to focus for intraday Long Bajaj-auto, Bhartiartl, Drreddy, Gail, Heromotoco, Lupin Stocks to focus for intraday Short Hdfc, Maruti, Ongc, Sbin, Yesbank, Emamiltd
