Download
1 / 1
10 likes | 31 Views
Axis Direct presents daily derivatives report presenting recommendations based on technical analysis. For trading in derivatives visit https://simplehai.axisdirect.in/offerings/products/derivatives<br>https://simplehai.axisdirect.in/share-stock-prices/nse/Ashok-Leyland-Ltd-31<br>https://simplehai.axisdirect.in/share-stock-prices/nse/Adani-Ports-&-Special-Economic-Zone-Ltd-21281<br>https://simplehai.axisdirect.in/share-stock-prices/nse/Bharat-Petroleum-Corporation-Ltd-2290<br>

E N D
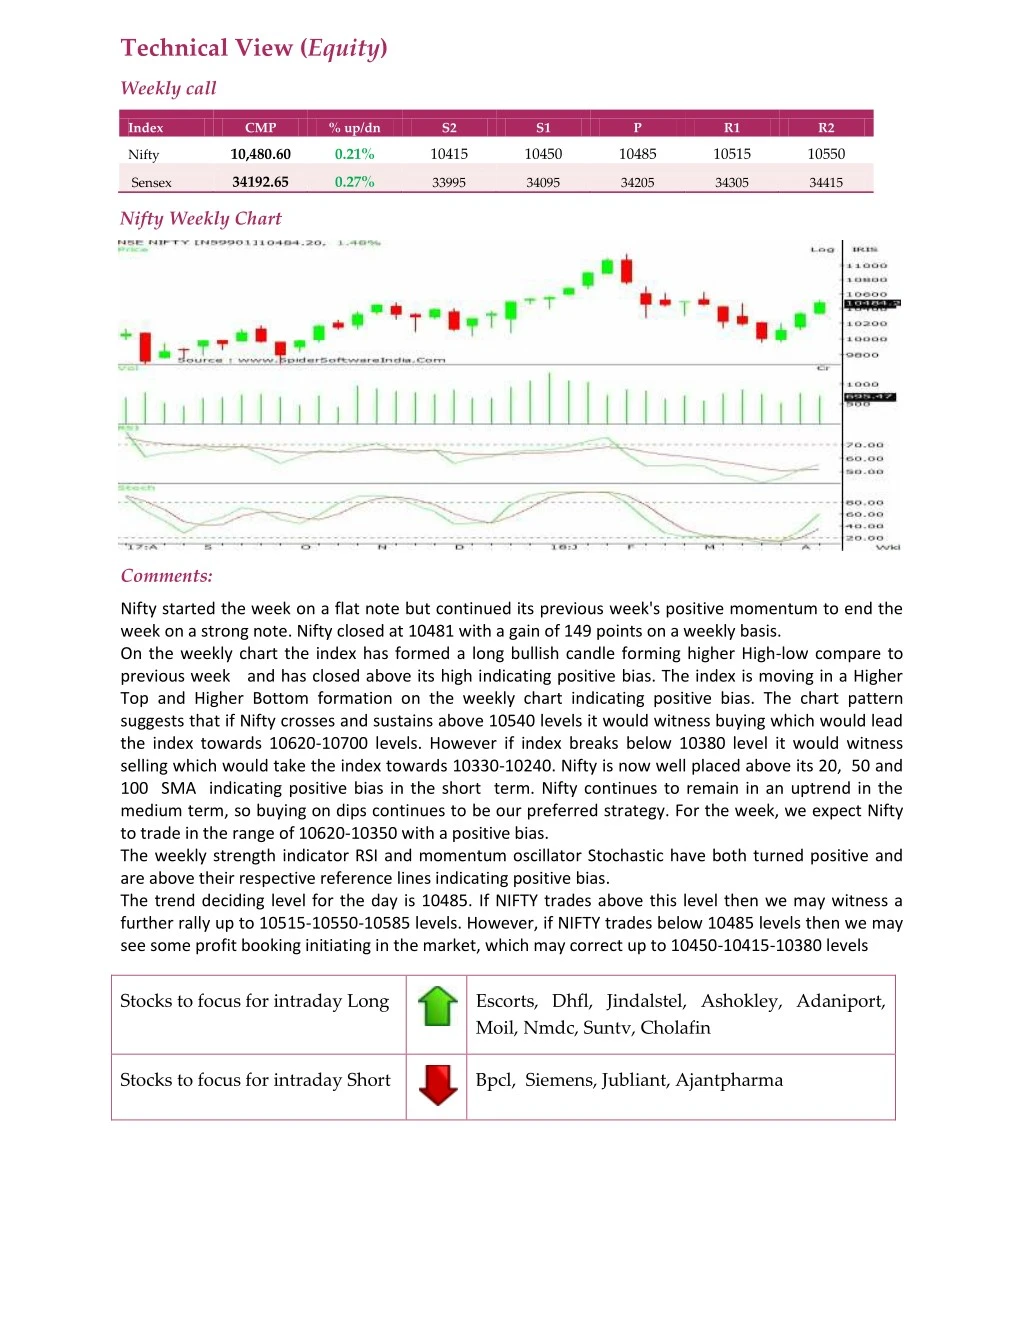
Technical View (Equity) Weekly call Index CMP % up/dn S2 S1 P R1 R2 10,480.60 0.21% 10415 10450 10485 10515 10550 Nifty 34192.65 0.27% Sensex 33995 34095 34205 34305 34415 Nifty Weekly Chart Comments: Nifty started the week on a flat note but continued its previous week's positive momentum to end the week on a strong note. Nifty closed at 10481 with a gain of 149 points on a weekly basis. On the weekly chart the index has formed a long bullish candle forming higher High-low compare to previous week and has closed above its high indicating positive bias. The index is moving in a Higher Top and Higher Bottom formation on the weekly chart indicating positive bias. The chart pattern suggests that if Nifty crosses and sustains above 10540 levels it would witness buying which would lead the index towards 10620-10700 levels. However if index breaks below 10380 level it would witness selling which would take the index towards 10330-10240. Nifty is now well placed above its 20, 50 and 100 SMA indicating positive bias in the short term. Nifty continues to remain in an uptrend in the medium term, so buying on dips continues to be our preferred strategy. For the week, we expect Nifty to trade in the range of 10620-10350 with a positive bias. The weekly strength indicator RSI and momentum oscillator Stochastic have both turned positive and are above their respective reference lines indicating positive bias. The trend deciding level for the day is 10485. If NIFTY trades above this level then we may witness a further rally up to 10515-10550-10585 levels. However, if NIFTY trades below 10485 levels then we may see some profit booking initiating in the market, which may correct up to 10450-10415-10380 levels Stocks to focus for intraday Long Escorts, Dhfl, Jindalstel, Ashokley, Adaniport, Moil, Nmdc, Suntv, Cholafin Stocks to focus for intraday Short Bpcl, Siemens, Jubliant, Ajantpharma