Download
1 / 1
10 likes | 180 Views
Abell 1795: Morphology in H 2. L.O.V.Edwards, F. Marleau, N.F.H. Tothill and G.Welch Saint Mary’s University Halifax, Canada. Photometric Results. CFHT-IR. Figure 1:

E N D
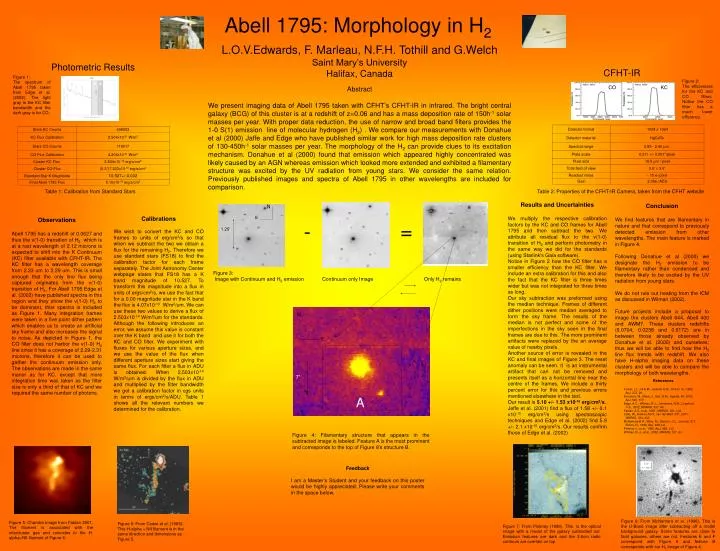
Abell 1795: Morphology in H2 L.O.V.Edwards, F. Marleau, N.F.H. Tothill and G.Welch Saint Mary’s University Halifax, Canada Photometric Results CFHT-IR Figure 1: The spectrum of Abell 1795 taken from Edge et al. (2002). The light gray is the KC filter bandwidth and the dark gray is for CO. Figure 2: The efficiencies for the KC and CO filters. Notice the CO filter has a much lower efficiency. CO KC Abstract We present imaging data of Abell 1795 taken with CFHT’s CFHT-IR in infrared. The bright central galaxy (BCG) of this cluster is at a redshift of z=0.06 and has a mass deposition rate of 150h-1 solar masses per year. With proper data reduction, the use of narrow and broad band filters provides the 1-0 S(1) emission line of molecular hydrogen (H2) . We compare our measurements with Donahue et al (2000) Jaffe and Edge who have published similar work for high mass deposition rate clusters of 130-450h-1 solar masses per year. The morphology of the H2 can provide clues to its excitation mechanism. Donahue et al (2000) found that emission which appeared highly concentrated was likely caused by an AGN whereas emission which looked more extended and exhibited a filamentary structure was excited by the UV radiation from young stars. We consider the same relation. Previously published images and spectra of Abell 1795 in other wavelengths are included for comparison. Table 1: Calibration from Standard Stars Table 2: Properties of the CFHT-IR Camera, taken from the CFHT website Results and Uncertainties We multiply the respective calibration factors by the KC and CO frames for Abell 1795 and then subtract the two. We attribute all residual flux to the v(1-0) transition of H2 and perform photometry in the same way we did for the standards (using Starlink’s Gaia software). Notice in Figure 2 how the CO filter has a smaller efficiency than the KC filter. We include an extra calibration for this and also the fact that the KC filter is three times wider but was not integrated for three times as long. Our sky subtraction was preformed using the median technique. Frames of different dither positions were median averaged to form the sky frame. The results of the median is not perfect and some of the imperfections in the sky seen in the final frames are due to this. The more prominent artifacts were replaced by the an average value of nearby pixels. Another source of error is revealed in the KC and final images of Figure 3. The reset anomaly can be seen. It is an instrumental artifact that can not be removed and presents itself as a horizontal line near the centre of the frames. We include a thirty percent error for this and previous errors mentioned elsewhere in the text. Our result is 5.10 +/- 1.53 x10⁻¹⁶ erg/cm2/s. Jeffe et al. (2001) find a flux of 1.58 +/- 0.1 x10⁻¹⁵ erg/cm2/s using spectroscopic techniques and Edge et al. (2002) find 5.9 +/- 2.1 x10⁻¹⁶ erg/cm2/s. Our results confirm those of Edge et al. (2002) Conclusion We find features that are filamentary in nature and that correspond to previously detected emission from other wavelengths. The main feature is marked in Figure 4. Following Donahue et al (2000) we designate the H2 emission to be filamentary rather than condensed and therefore likely to be excited by the UV radiation from young stars. We do not rule out heating from the ICM as discussed in Wilman (2002). Future projects include a proposal to image the clusters Abell 644, Abell 400 and AWM7. These clusters redshifts (0.0704, 0.0238 and 0.0172) are in between those already observed by Donahue et al. (2000) and ourselves; thus we will be able to find how the H2 line flux trends with redshift. We also have H-alpha imaging data on these clusters and will be able to compare the morphology of both wavelengths. N Calibrations We wish to convert the KC and CO frames to units of erg/cm2/s so that when we subtract the two we obtain a flux for the remaining H2. Therefore we use standard stars (FS18) to find the calibration factor for each frame separately. The Joint Astronomy Center webpage states that FS18 has a K band magnitude of 10.527. To transform this magnitude into a flux in units of ergs/cm2/s, we use the fact that for a 0.00 magnitude star in the K band the flux is 4.07x10⁻¹⁰ W/m2/um. We can use these two values to derive a flux of 2.503x10⁻¹⁴ W/m2/um for the standards. Although the following introduces an error, we assume this value is constant over the K band and use it for both the KC and CO filter. We experiment with fluxes for various aperture sizes, and we use the value of the flux when different aperture sizes start giving the same flux. For each filter a flux in ADU is obtained. When 2.503x10⁻¹⁴ W/m2/um is divided by the flux in ADU and multiplied by the filter bandwidth we get a calibration factor in cgs units in terms of ergs/cm2/s/ADU. Table 1 shows all the relevant numbers we determined for the calibration. E Observations Abell 1795 has a redshift of 0.0627 and thus the v(1-0) transition of H2 which is at a rest wavelength of 2.12 microns is expected to shift into the K Continuum (KC) filter available with CFHT-IR. The KC filter has a wavelength coverage from 2.23 um to 2.29 um. This is small enough that the only line flux being captured originates from the v(1-0) transition of H2. For Abell 1795 Edge et al. (2002) have published spectra in this region and they show the v(1-0) H2 to be dominant, thisr spectra is included as Figure 1. Many integration frames were taken in a five point dither pattern which enables us to create an artificial sky frame and also increases the signal to noise. As depicted in Figure 1, the CO filter does not harbor the v(1-0) H2 line since it has a coverage of 2.29-2.31 microns, therefore it can be used to gather the continuum emission only. The observations are made in the same manor as for KC, except that more integration time was taken as the filter size is only a third of that of KC and we required the same number of photons. = - 1.25’ Figure 3: Image with Continuum and H2 emission Continuum only Image Only H2 remains N E 7” References Cowie, L.L., Hi E.M., Jenkins E.B., York D. G., 1983, ApJ, 272, 29 Donahue, M., Mack, J., Voit, G.M., Sparks, W., 2000, ApJ, 545, 670 Edge, A.C., Wilman, R.J., Johnstone, R.M., Crawford, C.S., 2002, MNRAS, 337, 49 Fabian, A.C.,et al., 2001, MNRAS, 321, L33 Jaffe, W., Bremer, M.N., van der Werf, P.P., 2001, MNRAS, 324, 443 McNamara B.R., Wise, M., Sarazin, C.L., Jannuzi, B.T., Elston, R., 1996, ApJ, 466, L9 Pinkney J., et al., 1996, ApJ, 468, L13 Wilman, R. J., et al., 2002, MNRAS, 337, 63 A Figure 4: Filamentary structure that appears in the subtracted image is labeled. Feature A is the most prominent and corresponds to the top of Figure 8’s structure B. Feedback I am a Master’s Student and your feedback on this poster would be highly appreciated. Please write your comments in the space below. Figure 8: From McNamara et al. (1996). This is the U-Band image after subtracting off a model background galaxy. Some features are close to faint galaxies, others are not. Features E and F correspond with Figure 5 and feature B corresponds with our H2 Image of Figure 4. Figure 5: Chandra Image from Fabian 2001. The filament is associated with the intercluster gas and coincides to the H-alpha+NII filament of Figure 6. Figure 6: From Cowie et al. (1983). This H-alpha + NII filament is in the same direction and dimensions as Figure 5. Figure 7: From Pinkney (1996). This is the optical image with a model of the galaxy subtracted out. Emission features are dark and the 3.6cm radio contours are overlain on top