Download
1 / 22
220 likes | 344 Views
Math III U1D8 Warm-up: NONE. Return to your groups and finish the entire M&M’s activity. You will have a maximum of 20 minutes. REMEMBER – DUE FRIDAY!!!. Homework Check : Population Parameters and Sample Statistics Practice 1. a. parameter b. statistic 2. a. US adults

E N D
Math III U1D8 Warm-up: NONE Return to your groups and finish the entire M&M’s activity. You will have a maximum of 20 minutes.
Homework Check : Population Parameters and Sample Statistics Practice 1. a. parameter b. statistic 2. a. US adults b. 1200 randomly selected adults c. having an allergy is the variable in question d. 33.2% is the statistic e. 36% is the parameter 3. a parameter is a number that represents an entire population – it is fixed because the members of the population will not change. A statistic is representative of a sample, which can change depending on the subjects selected. One sample of 100 students will have a different GPA than another sample of 100 students. But the GPA of all students will not change.
Homework Check : Population Parameters and Sample Statistics Practice 4. a. the admissions office wishes the estimate the average cost b. population is all students at USC c. the total cost of all textbooks purchased by a student this semester d. 100 students is our sample e. the statistic is the total textbook costs. After receiving all 100 totals, find the mean. 5. a. all students currently enrolled at USC b. 10 students 6. A sample is a part of a population, much like Mrs. Jones’ 4th grade class is a part of the entire elementary school. Sometimes it takes a lot of time and money to ask everyone in the population, so a sample is a quicker, easier, and less expensive way to find out what you want to know.
Homework Check : Population Parameters and Sample Statistics Practice 7. A statistic is a number about a sample; a parameter is a number about a population. 8. a. the individuals are the TV owners in Virginia; the variable is watching the new program b. Assuming that there are more than 100 TV owners in Virginia, yes, this is a sample. c. the population is all of the TV owners in Virginia (or in the viewing area) d. the proportion of viewers in the sample who watch the new program at least once a week is a statistic 9. a. the individuals in the study are the Senators of the 109th congress; the variable is their party affiliation b. this is a population because we looked at the entire set of Senators c. This is a parameter because it comes from the population d. no
Homework Check : Population Parameters and Sample Statistics Practice a. population: all American households; sample: 1353 American households b. population: elementary school children; sample: 2625 elementary school children c. population: all adults; sample: every sixth person entering the mall within 3 hour period 11. a. statistic b. parameter c. statistic
Homework Check : Population Parameters and Sample Statistics Practice 12. a. statistic b. parameter c. parameter d. statistic 13. a. parameter b. statistic c. parameter d. parameter (assuming data was taken from all super bowl games ever played)
Homework Check : Margin of Error
Homework Check : Margin of Error 5. As the sample size increases, the margin of error decreases. You need a smaller margin of error because a larger sample makes you more sure of your results. 6. To cut the margin of error in half, you need to multiply the sample size by 4. The sample size is under the square root, so it will need to be the square of whatever you want to do to the margin of error.
Quiz Discussion: Short quiz Friday Unit 1 TEST Monday
Topic: • Simulations • Objective: • Use simulations to decide if differences between parameters are significant • • Use a random number table or random number generator on a calculator for randomized selection process • • Recognize and evaluate relevant data in reports
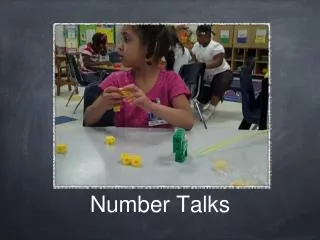
Simulations Simulation is a way to model random events, such that simulated outcomes closely match real-world outcomes. Why run a simulation? Some situations may be difficult, time-consuming, or expensive to analyze. In these situations, simulation may approximate real-world results; yet, require less time, effort, and/or money than other approaches.
v Sam’s Wholesale Club sells a tub of Zany Zoo animal crackers. There are 6 different animal figures (zebra, elephant, monkey, kangaroo, lion and tiger) included in each tub. Design and conduct a simulation of at least 20 trials that can be used to estimate how many handfuls of animal crackers a person needs to take to collect each of the 6 animals if you select a handful of ten animal crackers at a time.
What is the problem that we are simulating? how many handfuls of animal crackers a person needs to take to collect each of the 6 animals if you select a handful of ten animal crackers at a time What random device will you use to simulate the problem and how will you use it? We will use a random digit table using 1 digit numbers. Let 1 = zebra, 2 = elephant, 3 = monkey, 4 = kangaroo, 5 = lion and 6 = tiger. I will ignore the digits 0, 7, 8, and 9.
How will you conduct each trial? How many trials will you conduct? I will select 10 digits at a time and determine whether I receive all 6 animal crackers. I will repeat this process 20 times. 101 19223 95034 05756 28713 96409 12531 42544 82853 102 73676 47150 99400 01927 27754 42648 82425 36290 103 45467 71709 77558 00095 32863 29485 82226 90056 104 52711 38889 93074 60227 40011 85848 48767 52573 105 95592 94007 69971 91481 60779 53791 17297 59335 106 68417 35013 15529 72765 85089 57067 50211 47487
What are the results of these trials? We received all 6 crackers only 1 out of 20 times. What predictions can be made based on these results? There’s approximately a 5% chance of this occurring. Discussion points: The more trials you run, the closer you will get to the theoretical probability (Law of Large Numbers) This could be done with a die or calculator : RandInt(1, 6, 10)
When using random digit table, use the smallest number of digits possible: for 100 students, number them 00-99. Students tend to want to number only the sample, rather than the whole population. If you have 2000 students and want to pick 100, number 0001 – 2000. When working with the TI-84, you may want to have students seed your calculators first.
On a certain day the blood bank needs 4 donors with type O blood. How many donors, on average, would they have to see to get exactly four donors with type O blood, assuming that 45% of the population has type O blood? Let 00-44 represent people with Type O blood Let 45-99 represent people with other blood types Run RandInt(00, 99, 1) until you have 4 people with type O blood – record how many people it takes. Run 20 trials.
To seed the calculators: MATH, PRB, RAND, 16, STO →, MATH, PRB, RAND, ENTER To run the simulation: MATH, PRB, RandInt(00, 99, 1), ENTER First Trial: 92 69 60 50 98 35 28 95 3 23 it took 10 people to find 4 with type O blood Second Trial: 68 18 88 51 5 98 66 95 89 54 43 29 it took 12 people to find 4 with type O blood
Classwork: Designing Simulations
Homework: What Can We Use to Simulate?