Download
1 / 1
10 likes | 98 Views
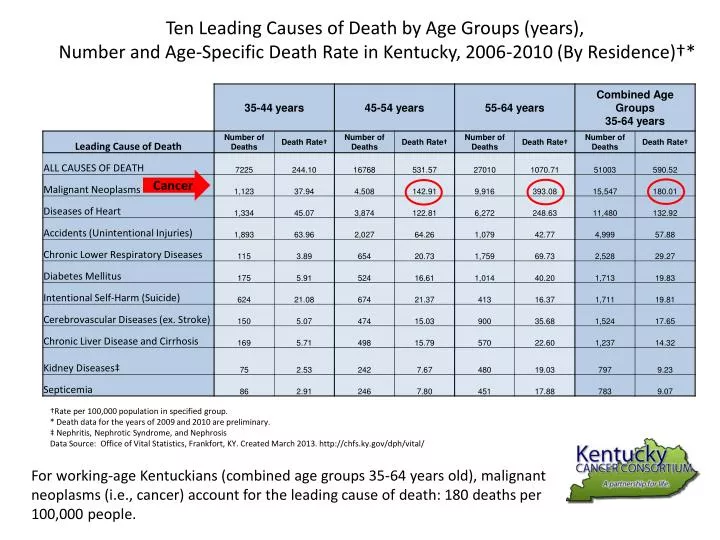
Ten Leading Causes of Death by Age Groups (years), Number and Age-Specific Death Rate in Kentucky, 2006-2010 (By Residence)†*. Cancer. †Rate per 100,000 population in specified group. * Death data for the years of 2009 and 2010 are preliminary.

E N D
Ten Leading Causes of Death by Age Groups (years), Number and Age-Specific Death Rate in Kentucky, 2006-2010 (By Residence)†* Cancer †Rate per 100,000 population in specified group. * Death data for the years of 2009 and 2010 are preliminary. ‡ Nephritis, Nephrotic Syndrome, and Nephrosis Data Source: Office of Vital Statistics, Frankfort, KY. Created March 2013. http://chfs.ky.gov/dph/vital/ For working-age Kentuckians (combined age groups 35-64 years old), malignant neoplasms (i.e., cancer) account for the leading cause of death: 180 deaths per 100,000 people.